Specifications for Chargeplanner in Optimize module (superusers only)
This article refers to the particularities within the Optimize module, applicable for Chargeplanner platforms. Please note that the Optimize module is only accessible for superuser.
Consult this article to find a complete step-by-step guidance when using Optimize. The headings below are extra comments on the generic information in these articles and follow the same (sub)headings.
2. Preparing the list of locations
After downloading the Excel template file, you’ll need to configure it with data specific to your testing locations. Begin by completing the information required in Step 1 of this article. Once that’s done, proceed with Step 2 and 3 here to finalize your setup and continue the configuration process.
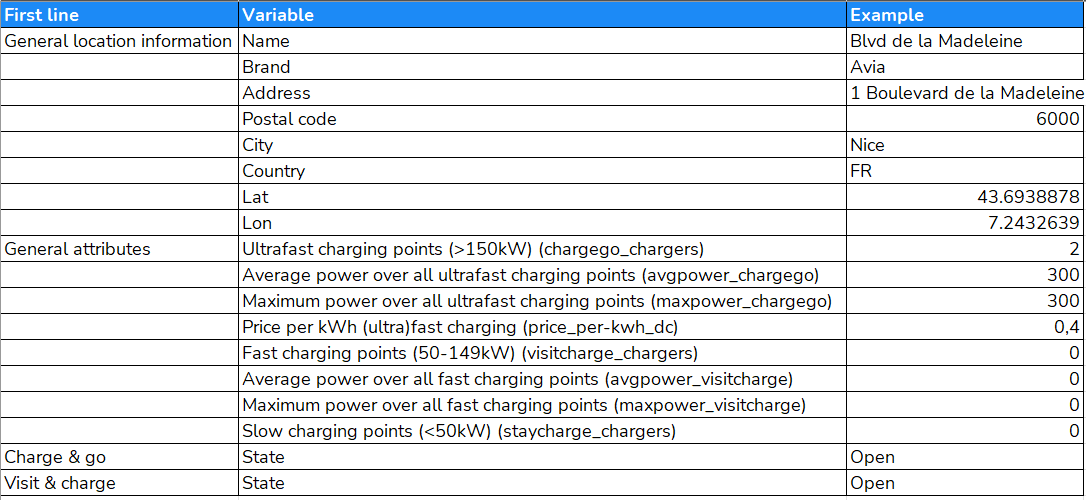
Step 2 : Location information required for Chargeplanner
Here you need to give the general configuration for the charging location. When you leave a cell for a characteristic in the Excel file blank, the default value will be assigned/calculated.
- # Ultrafast charging points (>150 kW)
- # Fast charging points (49 - 150 kW)
- # Slow charging points (<50kW): As our model does not predict consumption for Stay & Charge, this will have no impact on the prediction. You can delete this column from the table or leave it empty. You can then adapt this procedure to specific cases.
- Average power of all chargers by type: indicate the average power of all charging points on the location by power category (fast, ultrafast).
- Maximum power among all chargers by type: indicate the maximum power of all charging points by power category (fast, ultrafast)
- Price per kWh (ultra) fast charging: indicate the price per kWh for the location
TIP: HOW TO FIND AN OPTIMAL CONFIGURATION
If you want to assess the optimal configuration for a site, it is possible to test multiple combinations of charging points. Each tested combination should be a separate line (linked to the same location name).
Step 3 : Segment information required for Chargeplanner
Here you can give extra information on each of the segments "Charge & Go" &"Visit & Charge". When you leave a cell for a characteristic in the Excel file blank, the default value will be assigned/calculated. It is also possible to remove these columns from the table.
- State: Enter here "Open" for "Charge&go" & "Visit&charge" (They are "Open" by default).
This is an example of how the file can be filled out:

Important remark : The number of lines to be processed per file is limited to 500.
Once you have completed the file, you are ready to go to the next step: Upload file & calculate
4. Validating your results
After importing your file, and at the end of the calculation, the Optimize module allows you to view the results on a map or in a table.
- When you click on 'Table', you will see the results for each site in the list as well as extra information: Potential, # of electric cars, FTE, welfare, density, local activity.

The table shows the list of all the tested locations together with the following information:
- Usage: Predicted annual usage in kWh/year for the charging location in total
- Usage Charge & go :
- Usage Visit & Charge:
- Usage per charging point: Predicted annual usage in kWh per charging point
- Net impact on brand: the net impact on the entire own brand (including cannibalization on other own locations)
- # UF charging points: Number of ultra-fast charging point(s) indicated in the project for each site
- # F charging points: Number of fast charging point(s) indicated in the project for each site
- # S charging points: Number of slow charging point(s) indicated in the project for each site
- Maximal power of the ultrafast charging points : Maximal power of all the ultrafast charging points of the site
- Average power of the ultrafast charging points : Average power of all ultrafast charging points of the site
- Maximal power of the fast charging points : Maximal power of all the fast charging points of the site
- Average power of the fast charging points : Average power of all fast charging points of the site
- Ad hoc price charging point DC : Price per kWh indicated for ultra-fast charging in the project
- Local activity <30min: Number of visits per year with a duration less then 30 minutes within a radius of 300m
- Local activity 30min-2h: Number of visits per year with a duration between 30min - 2h within a radius of 300m
- Local activity >2h: Number of visits per year with a duration >2h within a radius of 300m
- Car passage: number of cars passing by per week
- # UF charging points 3 mins: Number of ultrafast charging points within 3mins car drivetime
- # F charging points 3 mins: Number of fast charging points within 3mins car drivetime
- # UF charging points 10 mins: Number of ultrafast charging points within 10mins car drivetime
- # F charging points 10 mins: umber of fast charging points within 10mins car drivetime
- Developable public slow charging power own zone: indicates the slow charge power to be developed in the area, any negative number indicates that the estimated power for slow charge has already been reached and exceeded.
- Developable public slow charging power (6 min): indicates the slow charge power to be developed in the 6-min zones, any negative number indicates that the estimated power for slow charge has already been reached and exceeded.
Because our model works with travel times to calculate predictions, locations located in a large parking may lead to poor results. If this is the case, we recommend updating the traveltimes by selecting a road segment close to the entrance of the parking. This will lead to a more accurate result. This can be done in next step
You can now go back to the general article to have more details on how to filter and sort the table.
5. Updating the list of locations
Indicate and validate the high impact characteristics
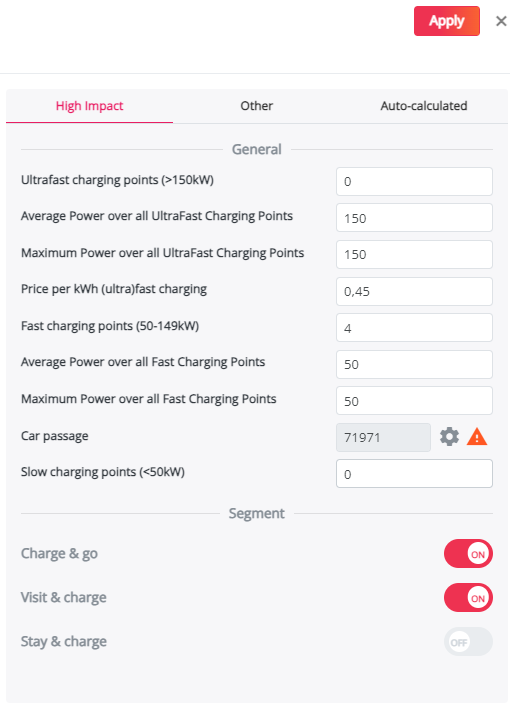
This window displays the objective location characteristics of the site which have an important impact in the model. Here you will recognise the configuration that was entered in Step 2.
Car passage
This parameter indicates the number of cars per week that pass by in the area and from which your location can capture passing EV-drivers.
Go straight to this article to know when and how to update it.
Indicate and validate the other impact location characteristics
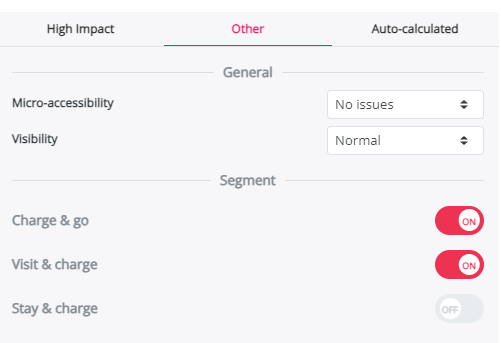
This window displays the qualitative location characteristics of the site that also have a significant impact in the model:
Go straight to this article to know when and how to update it.
Next, you can return to the main article to import your locations in bulk into the Optimize module.


