How to measure the impact of a closure or relocation on your network?
For unprofitable locations w/o growth potential you might consider closing or relocating the location. Or maybe your lease is coming to an end and you want to investigate the impact. To know whether it's worthwhile pursuing the closure, it's important to correctly evaluate the impact on your existing sales network. This article will guide you step by step in how to make sure you correctly interpret the impact of a closure, considering all churn & recuperation dynamics, as well as the role of the halo effect (the reinforcing effect of offline & online).
1. Make sure your baseline network is up-to-date
All near future changes (openings, closures, relocations..) within your network should be reflected in the future state period that you want to use to make your closure simulation on.
Also missing competitors that can be relevant for this closure case should be added to the future state period for you to have accurate model results.
In case your future state period is not up-to-date; modify the changes on the right page in Data Management.
2. Create your closure/relocation simulation
Step 1: Head to Location Planning
Step 2: Click on the left sheet icon to start a new simulation.

Step 3: Select the most up-to-date baseline network to simulate your future network changes.
Step 4. Look for the the location marker of the location you want to close on the map. Click on the marker and select Close in the pop-up that appears.
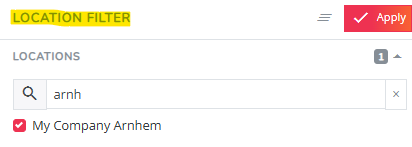
TIP: Use the location filter from the left settings bar to find your location faster. Just make sure to clear your filters again after you've found and closed the location, cause this filters your map and the results section!
Step 5: Now click on the orange calculate button in the left side panel to let de model calculate the impact for each living block.
3. Investigate the impact
Step 6: Analyze the results of your case. The results section below the map provides your business case.
The two black boxes show the total network impact of the closure in terms of predicted sales and market share.

The different tabs underneath allow you to analyze the simulation results in detail with which you gain insights into churn, recuperation dynamics, the impact on online sales & competitors.
The brand impact in the summary tab displays the total total predicted churn on your existing sales network. The total predicted churn is a combination of the drop in online sales (due to lower brand awareness in the region of the closure) and the recuperation by the existing nearby locations. Click on the deepdive arrow icon to investigate the impact also on segment level (if relevant).

The locations that will recuperate the most (in %) of the lost sales are displayed in the top 5 positive impacted locations. These locations will gain extra revenue due to the closing of the existing location.

To see all locations that will recuperate from the lost sales (in case there would be more than 5), open the 'own locations' tab. This will include the complete overview of your locations.
The negative impact on the virtual channel will also appear in the top 5 negative impacted 'locations', next to the closed location sales. Closing a location is likely to affect the halo effect, as the visibility and brand awareness in the local environment decreases. To preserve your local brand awareness in that region, we recommend exploring alternatives such as billboards or digital advertising.
The combination of loss of the closed location sales, loss of halo effect and the recuperation of the neighboring locations results in the total predicted churn caused by closing the location.
To have a complete overview, you can also check the competition tab to see which of your competitors will benefit most from your closure. Impacted competition is sorted from positively impacted to negatively; you'll find your biggest competitors at the top.
TIP! Use the Brands filter in the left side panel to only see the results for a specific competitor brand.
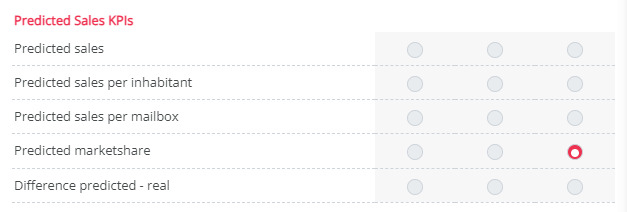
Step 7: To visualize your high risk of churn customers on the map, click on the Map layers icon in the top right corner () and select predicted market share in the difference layer column. Select apply to confirm your selection.

This map layer will highlight all zones where there is a drop in predicted market share after closing the location. Make sure to display the map legend to determine the exact predicted market share drop in each of the highlighted zones.
Remark! When you close a location, a strong retention campaign to maintain your customers is your greatest asset. Consult this flow to know how to do this.
4. Export your results
Step 8: Add other relevant business information to your quick scan business case evaluation (eg. the cost structure of the location, rental prices etc.) to finalize your case.
Step 9: Click on the download Excel button () to export the numbers of this business case in an excel file. You can now share this with the right stakeholders.


