Grow your quick scan simulation results into a final business case
Step 1: Go to Location Planning.
Step 2: Create a new simulation. Here you can read how to execute all possible network changes in your simulation.
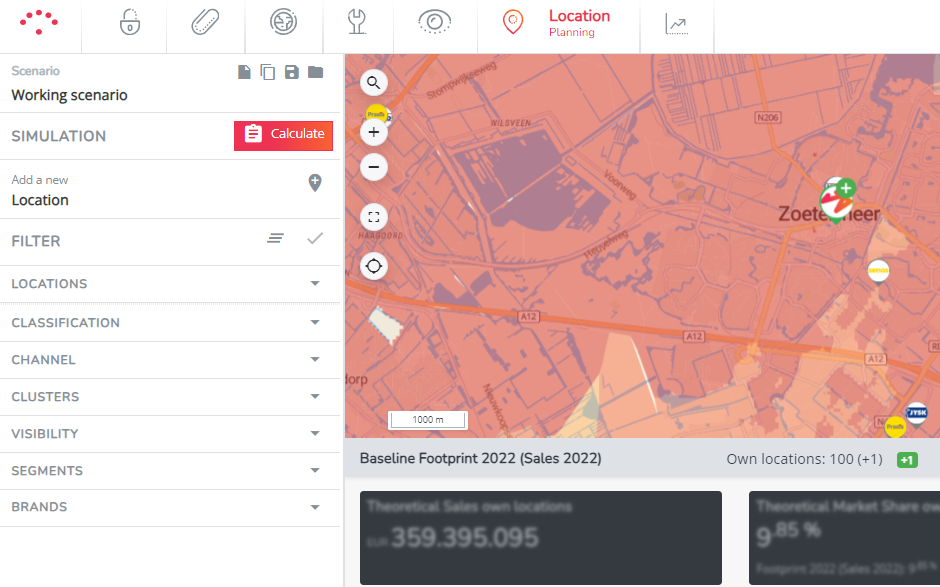
Step 3: Make sure you have pressed 'Calculate' on the left to activate the gravity model. When results below the map are blurry, the results were NOT calculated.

Step 4: Read the results of your simulation changes below the map. The following steps will be explained by taking the example of adding 1 new location to the network.
The two black rectangles display the total predicted network turnover after calculation of all changes. The percentages show the growth / decline compared to the baseline network before the changes.
Use the tabs underneath to gain insight into the cannibalization dynamics in your own network (on- and offline), but also on competitors.

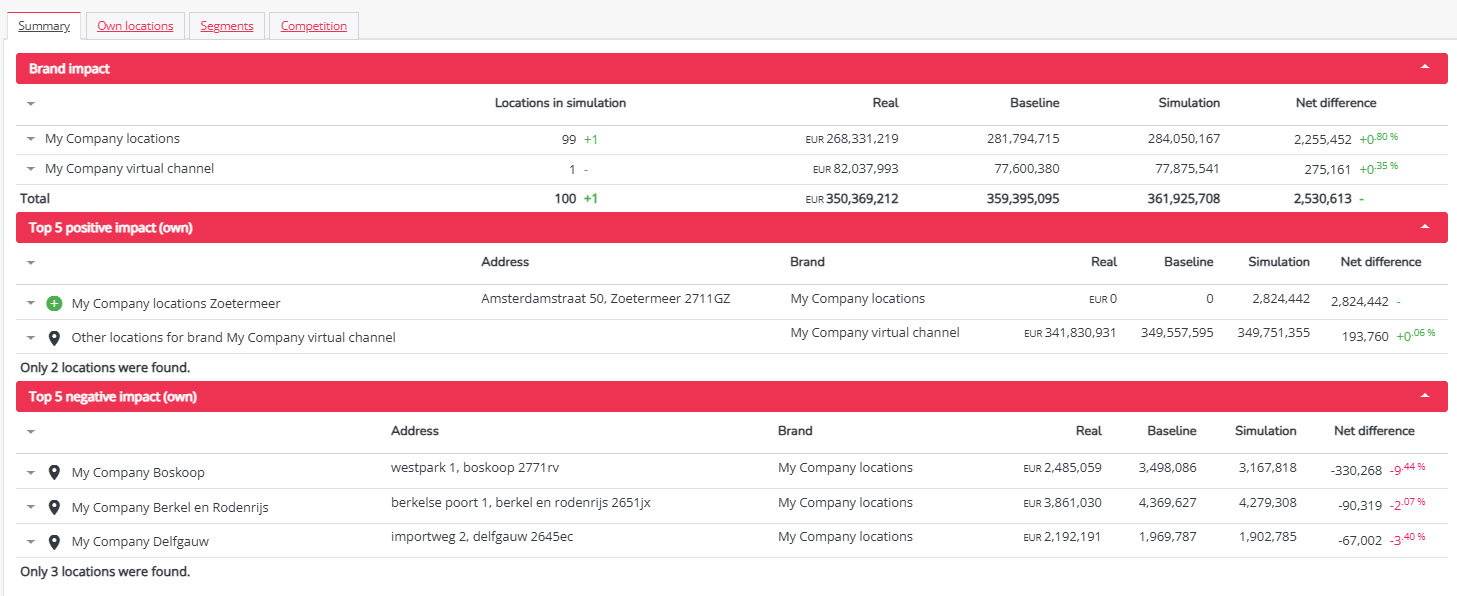
- The Summary tab includes a summary of the overall turnover impact on your brand;
- The brand impact indicates the overall impact of all network changes on your brand. When the halo-effect is incorporated in the model, you can see both the impact on the physical and the online sales network. If you have several product or service segments in your platform, you can click on the arrow icon to investigate the impact for each segment (or go to the segment tab straight away). The number you see here is the combination of all internal cannibalization dynamics.
- The top 5 positive impact (own) displays the top 5 locations that gained the most in absolute revenue due to the network changes in the simulation made. This is where you will find the predicted sales for new locations (In simulations with more than 5 opened locations, this will only display the 5 locations with the highest predicted sales. In that case you can find the other predicted location turnovers in the next tab 'own locations'.)
- The top 5 negative impact (own) displays the top 5 locations that lost the most in absolute revenue due to the network changes in the simulation made. So in case you've opened certain locations in your simulation, this top 5 displays the locations that will be cannibalized most due to the changes.
- The own locations tab displays the overview of all locations in the network together with their baseline turnover (predicted turnover corrected for reality turnover), the turnover after the simulation changes and the net difference (both absolute and relative). Clicking on the arrow icon left of the name will display the impact on segment level per location (if relevant).
- In case you have several product or service segments in your platform, the segment tabs allow you to investigate the impact on segment level.
- The competition tab allows you to investigate the impact of the network changes on the competitor network. Here you can identify which competitors are most impacted as results of the changes made in your simulation. The competitor brands are sorted from most positive impacted to most negative impacted (in absolute numbers). (Remark! Be aware that for impact calculations of competitors, your model is being used to estimate turnovers for competing goods/offers. We don't have actual competitor brand turnovers)
TIP! Use the location filter in the left side bar to filter the results section on specific locations or brands.
Step 5: In case you have difficulties understanding why the location result is so high or so low, consult this article to understand model outcomes.
Step 6: Transform this quick scan evaluation into a final business case. To do this you'll need to verify the following:
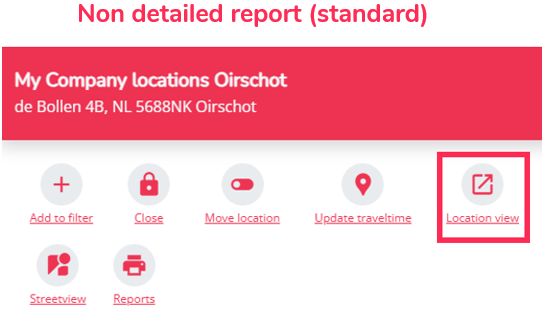
1. Validate the environment of the new location by clicking on the marker of the new location on the map, and opening the location view report:
- Environmental situation: Are competitors and local activity correctly mapped and up to date?
- Score location characteristics of your biggest competitors: These are competitor locations for which the model predicts the highest negative impact after opening your new location. Location characteristics for competitors are neutral by default; we strongly advise to score these parameters according to your information and adjust them in the Data Management module - location management.
2. Is your new location situated near the border of the region covered by the model? Then you may need to address the following question: Do you expect buying flux imbalances between the region within model's scope and the surrounding area? Since the external borders of the model are strict and do not account for influences from abroad, imbalances should be incorporated into the calculation of the business case. Be sure to mention this in the conclusion paragraph at the end of the location view report, so other stakeholders are aware of these limits.
3. Consider other external factors that could potentially influence your business case. For instance, changes in the mobility situation might occur in the future. External factors that are not incorporated in the model should be included along with valuable context information in the conclusion paragraph at the end of your location report.
4. Add a safety interval in your conclusion. The advanced predictive model typically reaches an accuracy rate of 85% to 90%. Therefore, it's advised to include a safety margin of 10%, in both directions, in the results. When establishing these safety intervals, consider that certain cases may be hypersensitive to very local situations, such as having many nearby competitors or being situated in dense urban areas. Contact an expert if you are uncertain about the interpretation of a result.
Step 7: Export and Share a Simulation Report – Two Available Options
Once your simulation is complete, you can generate two types of reports, depending on your needs and platform configuration: the standard report (Location View Report) or the case study report. These reports are designed to inform the relevant stakeholders.
1. Standard Report – Concise and Quick
The standard report provides a condensed view of the simulated location’s performance, showing only the key performance indicators (KPIs). This report is useful for quick sharing or an overview that doesn't go into detail.
To export it:
- Click on the marker of the new location on the map.
- Select "Location View". The report will open in a new tab.
- Use Ctrl+P (or right-click > Print) and choose "Save as PDF".

2. Case Study Report – Detailed and Analytical (if configured)
The case study report is an enhanced version of the standard report. t provides an in-depth analysis of the simulated location, including sales forecasts, catchment area, cannibalisation effects, performance indicators, and an evaluation of potential based on various factors (residential and workplace potential, passage, accessibility, visibility, etc.).
To generate this report:
- Click on the marker of the new location on the map.
- Click on "Reports", then in the pop-up window, select "Case Study Report" (in the desired language, if available).
- Click "Launch" to start the report generation.

Once your report is ready (either standard or case study):
- Go to your user menu (top right corner), under the "Reports" section.
- A green checkmark will indicate that the report is ready to download.
- Click on the cloud icon to download it as a .doc file.
Important! Please note that our platforms are able to calculate complicated combined simulations (eg. 10 openings + 10 closures + takeovers & relocations). For these simulations you can more or less follow the same steps as explained above, except that the location view report might be hard to interpret (due to the combined/aggregated effects of multiple changes). For such simulations we recommend investigating the overall impacts within the results section of the Location Planning module for a clearer understanding.

