
Overview screen display Marketing Efforts
Screen display & functionalities
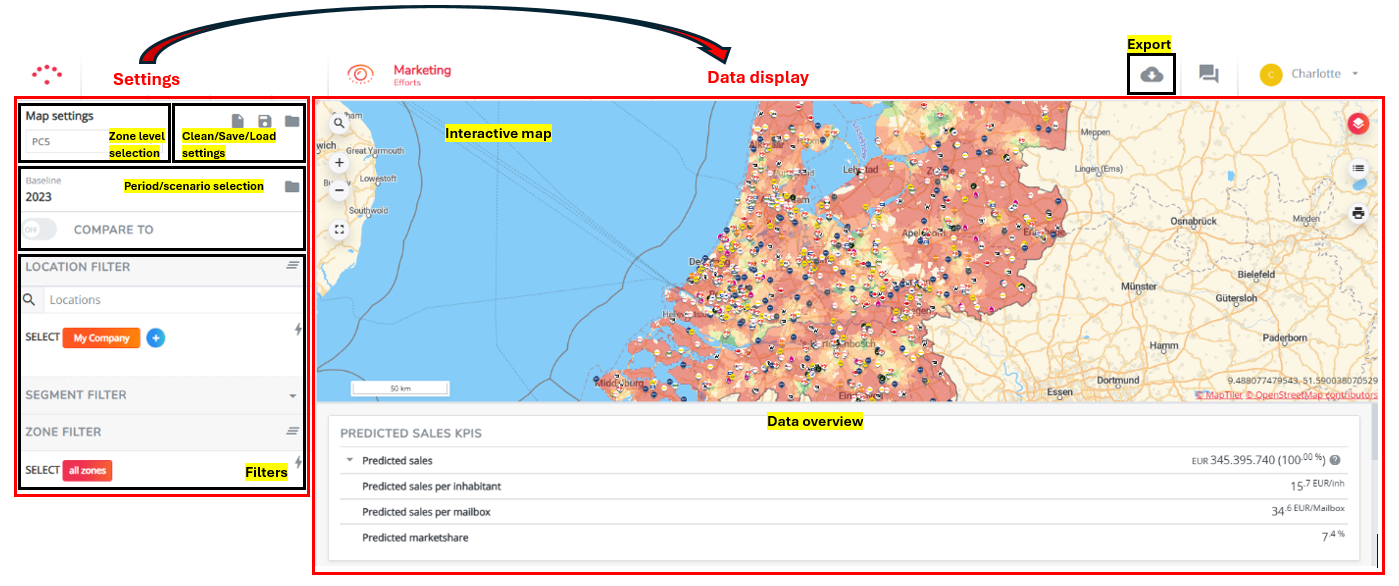
Module settings
Map settings
- To clear all applied settings & reset the default settings (configured by us)
- To save your applied settings in a custom View (this saves you to reapply settings for the next time)
- To load preconfigured views (advanced settings) or a previously saved custom view
Zone level selection
Choose the geographical zone level of the zone data on the map:
- Detailed (or custom name)
- Aggregated (or custom name)
- Other aggregation layers: only possible when configured
Period / simulation selection
Allows you to select which data you want to display: data from a preset baseline period or the (model) data from a previously created simulation.
Filter section
If you don't want to display all data (for the entire network, for all product segments and for all zones within the country)
- Filter on locations from the different brand (groups)
- Filter on segments (if multiple segments were uploaded - not always enabled)
- Filter on zones (corresponds with your applied zone level)
Data display
Interactive map
Use the map to visualize the data corresponding to the applied settings for the selected baseline period/simulation.
Functionalities left:


Functionalities right:


Click on the displayed logo's and zones on the map to retrieve more information:
- To open the location pop-up with all location information, click on the location logo's on the map
- only for own locations and competitors (locations should be visible by enabling the corresponding map layers)
- open the location view report (automated report) of own locations (possible to save as PDF)
- To open the zone pop-up with all zone information, click on a zone on the map
- the zone code corresponds to the applied zone level
- open the zone report (possible to save as PDF)
Data overview
Summarizes all uploaded data in absolute numbers for your platform, usually divided into the following categories;
Network data
- Sales KPIs - your sales data for your own brand locations only (will be N/A for other competitor brands)
- might contain the model results for your locations; KPIs are proceeded by 'predicted'
- Click on
to see the data for the location separately (corresponds to your location filter)
Market data
- Market size
- Competition - corresponds to the selected brands in the location filter
- Socio demographics
- Location characteristics - the amount of local activity in the network for the applied period
- .... (other categories possible)
Please note that the numbers of these data within these categories get recalculated when applying different filters in the settings. (Read examine location & examine zone data for more information)
Export to XLS - button
Export the data for the chosen filters to excel. Different export are possible.