
How to display car passage or footfall
1. How to display car passage
When the car passage data pack is enabled on your platform, you can investigate car passage volumes for road segments in the selected country.
For more information about what car passage means and how it is calculated, see the article car passage and footfall datapack
Follow these steps
Step 1. Go to Marketing Efforts or Location Planning.
Step 2. Click the map layers button in the upper-right corner of the map and enable the Car passage map layer.
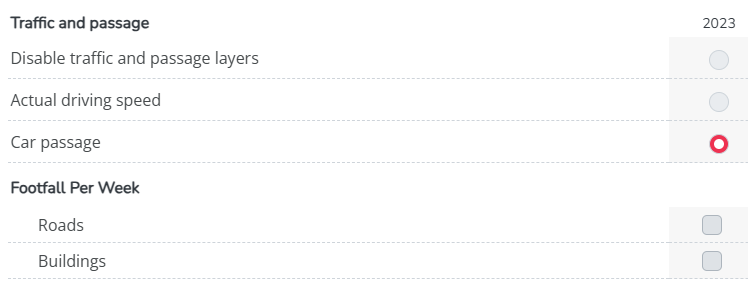
Step 3. Zoom in on the road segment you want to investigate until the car passage numbers are displayed on the map.
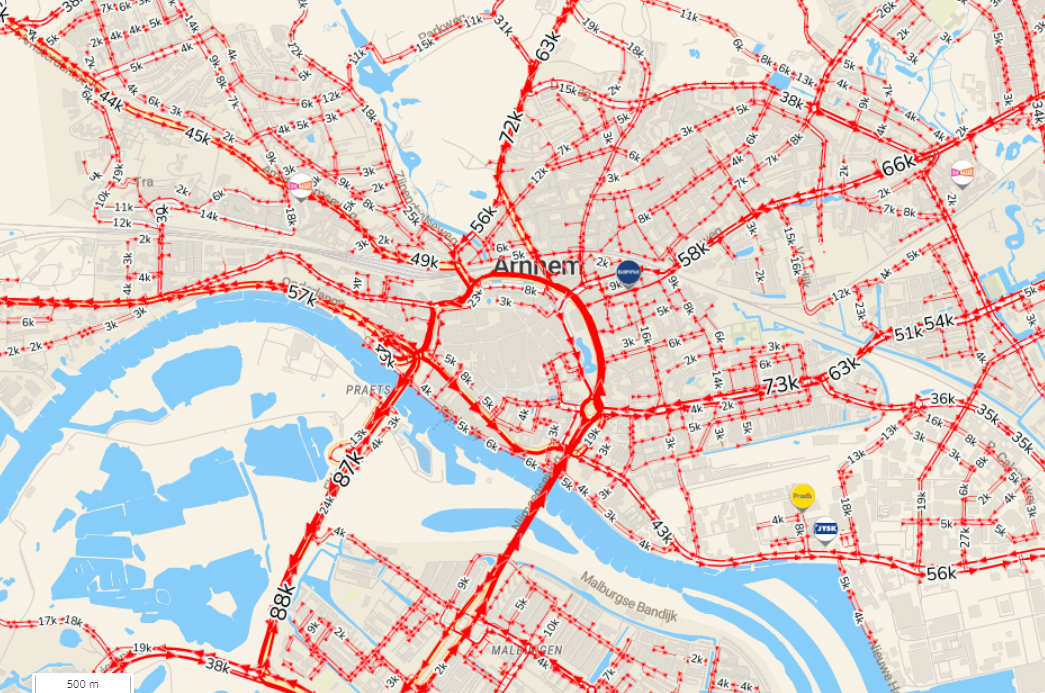
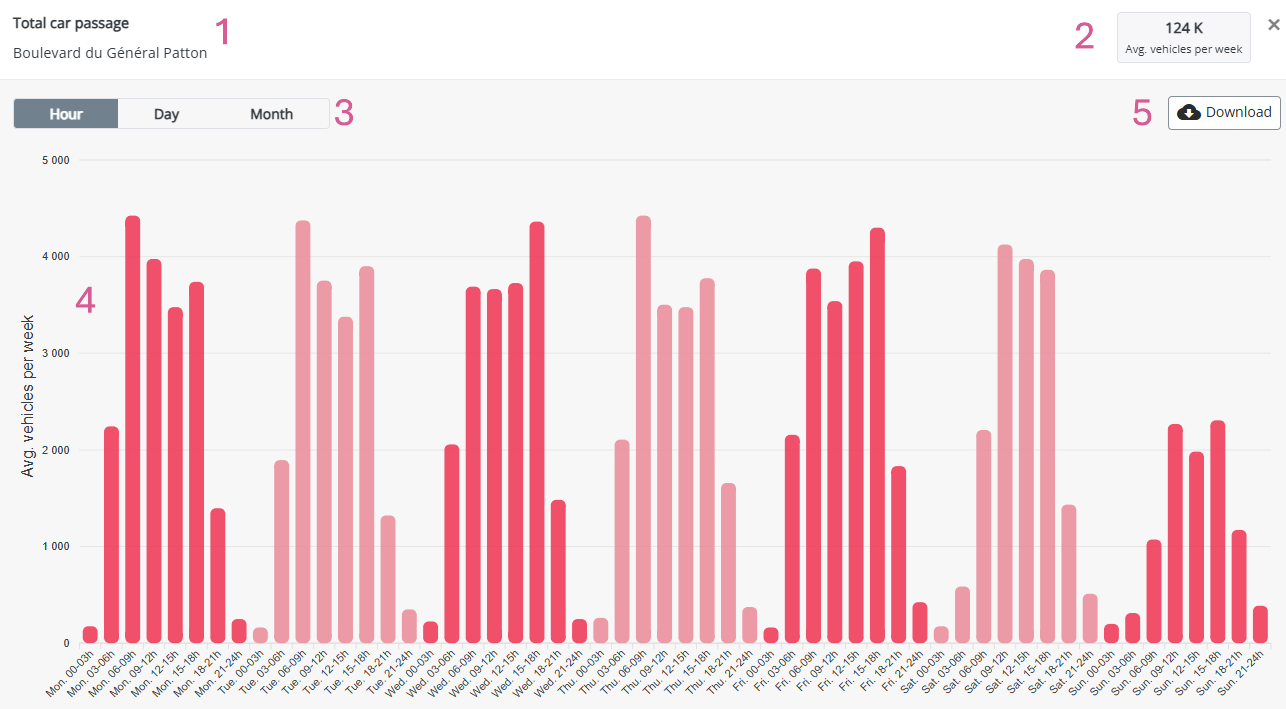
Step 4. Click the number on the road segment. Make sure you are zoomed in sufficiently. A pop-up window will open with the car passage details for that road segment. There you can investigate the weekly passage volumes for a given road segment
What is shown in the car passage pop-up?
The pop-up window contains:
- The name of the road segment
- The weekly car passage volume
- Graph options: you have the option to choose for a line or bar plot and to choose between hourly or daily buckets
- The selected graph
- Export button to download the table behind the graph as an Excel file
More details about car passage in the custom reports
More detailed car passage figures can be available in custom reports, such as Performance Reports or Case Study Reports, depending on your platform configuration.
To view these graphs, download a report for a specific location from:
- Marketing Efforts, for Performance Reports.
- Location Planning, for Case Study Reports.
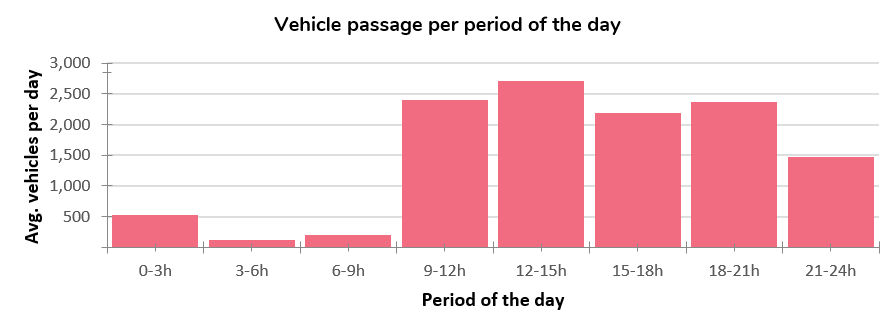
The generated report can include additional figures, such as:
- Average car passage per period of the day, averaged across all days of the week.
Note: If these reports or figures are not enabled on your platform, please contact support@retailsonar.com for more information.
2. How to display Footfall?
When the footfall data pack is enabled on your platform, you can investigate weekly pedestrian volumes in the selected country.
For more information about what footfall means, including the difference between road-level and building-level footfall, see the article Car Passage and Footfall Data Pack.
Follow these steps
Step 1. Go to Marketing Efforts.
Step 2. Click the map layers button in the upper-right corner of the map and enable the Footfall per Week map layer. Choose one of the available footfall visualization options:
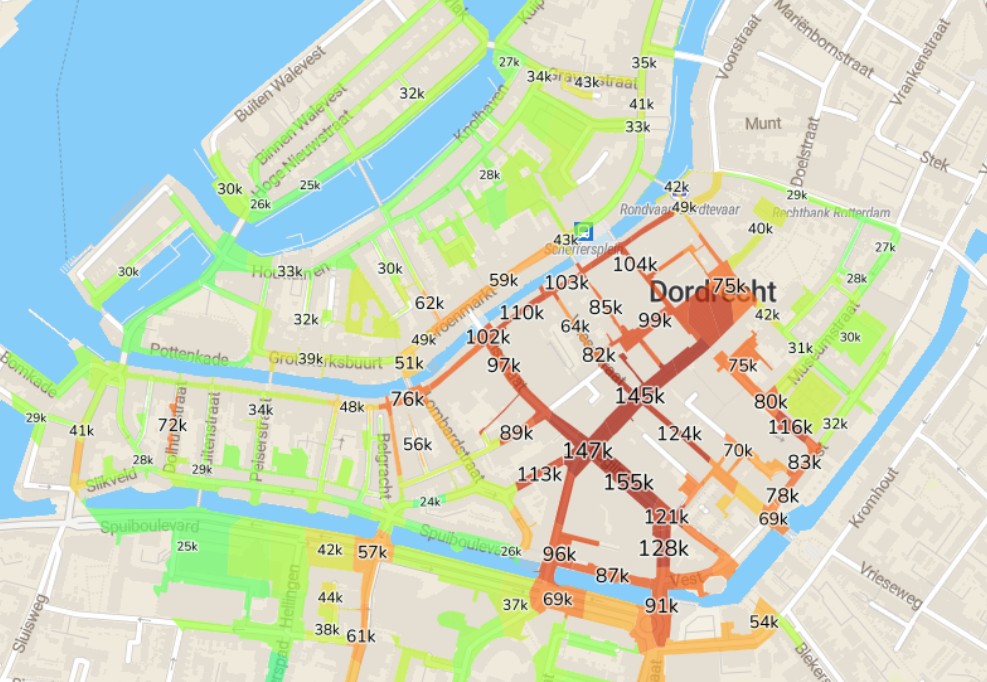
- Road-level which shows weekly footfall on road segments.
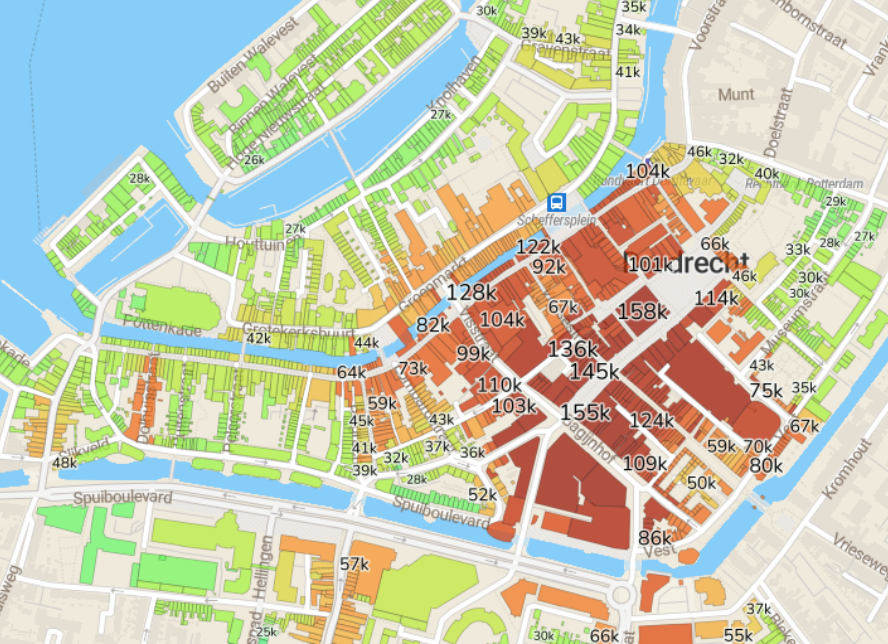
- Building-level, which shows weekly footfall at building level.
Both options visualize footfall, but at a different spatial level.
Buildings | Roads |
Important remark
Footfall is only predicted within shopping areas. This means that footfall values may not be available for every road segment, building, or location.
More details about footfall in custom reports
Unlike car passage, footfall does not have a pop-up graph in the map view showing day-level or hour-level availability.
More detailed footfall figures can be available in custom reports, such as Location Performance Reports or Case Study Reports, depending on your platform configuration.
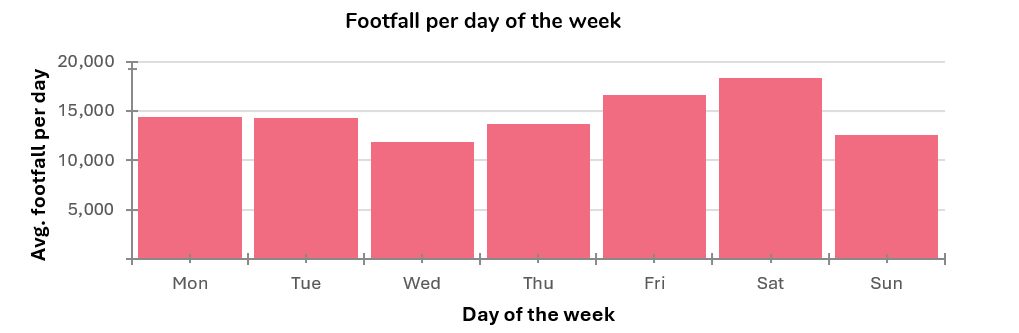
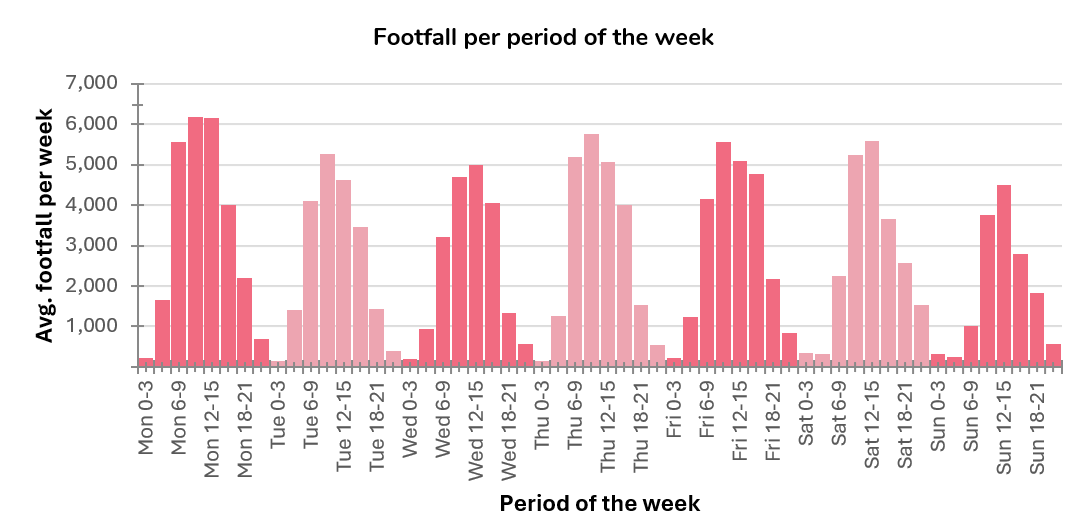
The generated report can include additional figures, such as:
- Average footfall per period of the day (average across all days of the week)

- Average footfall per day of the week
- Average footfall per period of the week
Note: If these reports or figures are not enabled on your platform, please contact your Retailsonar consultant for more information.