
Activating your (potential) customers: who should you target ? (Marketing)
Usecase
Local marketing campaigns such as door-to-door leaflet distributions or digital advertising can help you to activate new or re-activate existing customers. This article will help you to identify the right zones to target in order to reach an optimal return on investment of your activation campaign.
You will be able to use this information to activate potential customers of existing locations, but also for new locations.
Step-by-step guide
Step 1: In case you want to launch an activation campaign for a new location, make sure you have created & saved a simulation with the new location added to your network. (Read this article to know how to do this)
Step 2: Go to Marketing Efforts.
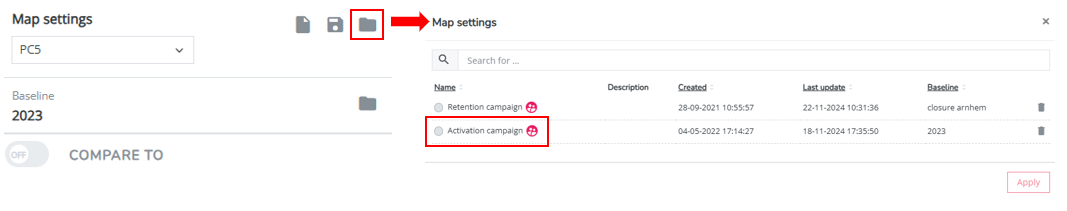
Step 3: To facilitate this exercise, we've already preinstalled the settings you will need for this usecase. You can load these settings by clicking on the load icon in the map settings section, and selecting 'Activation campaign'.
Good to know: If you know how to install these settings yourself, you can also apply the right location and zone filter yourself to do this exercise.
Note that this view is by default configured on the detailed zone level. The RetailSonar platform typically operates on this level to make accurate predictions per living block, and is also the recommended level to follow the steps below. You might need the output of this exercise on another level (Eg. BD or NIS 6 for leaflet distribution (examples for Belgium) or zipcode for digital advertising). Your final export (see step 8) will therefore automatically contain the aggregated zone* codes as well.
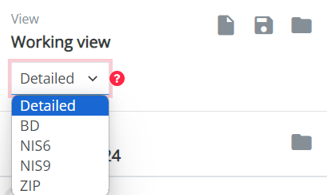
*The configured zone levels as seen on the image above are custom and defined & named before the set-up of the platform.
Step 4: The 'Activation campaign' settings are by default based on the most recent baseline period. You can still alter this by selecting the right data period or simulation, representing the location(s) you want to launch an activation campaign for.
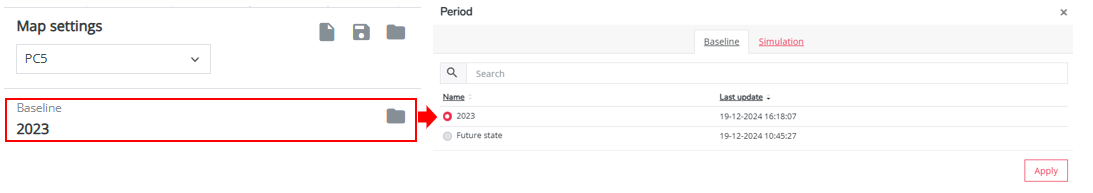
On the map, you will now see a filtered area around all of your locations in the network (corresponding to the chosen data period). The filtered area covers a collection of zones that together reach 50% of the total predicted sales of all network locations. This coverage percentage is a default % but can be adjusted later on, depending on your campaign budget (see also step 7.)
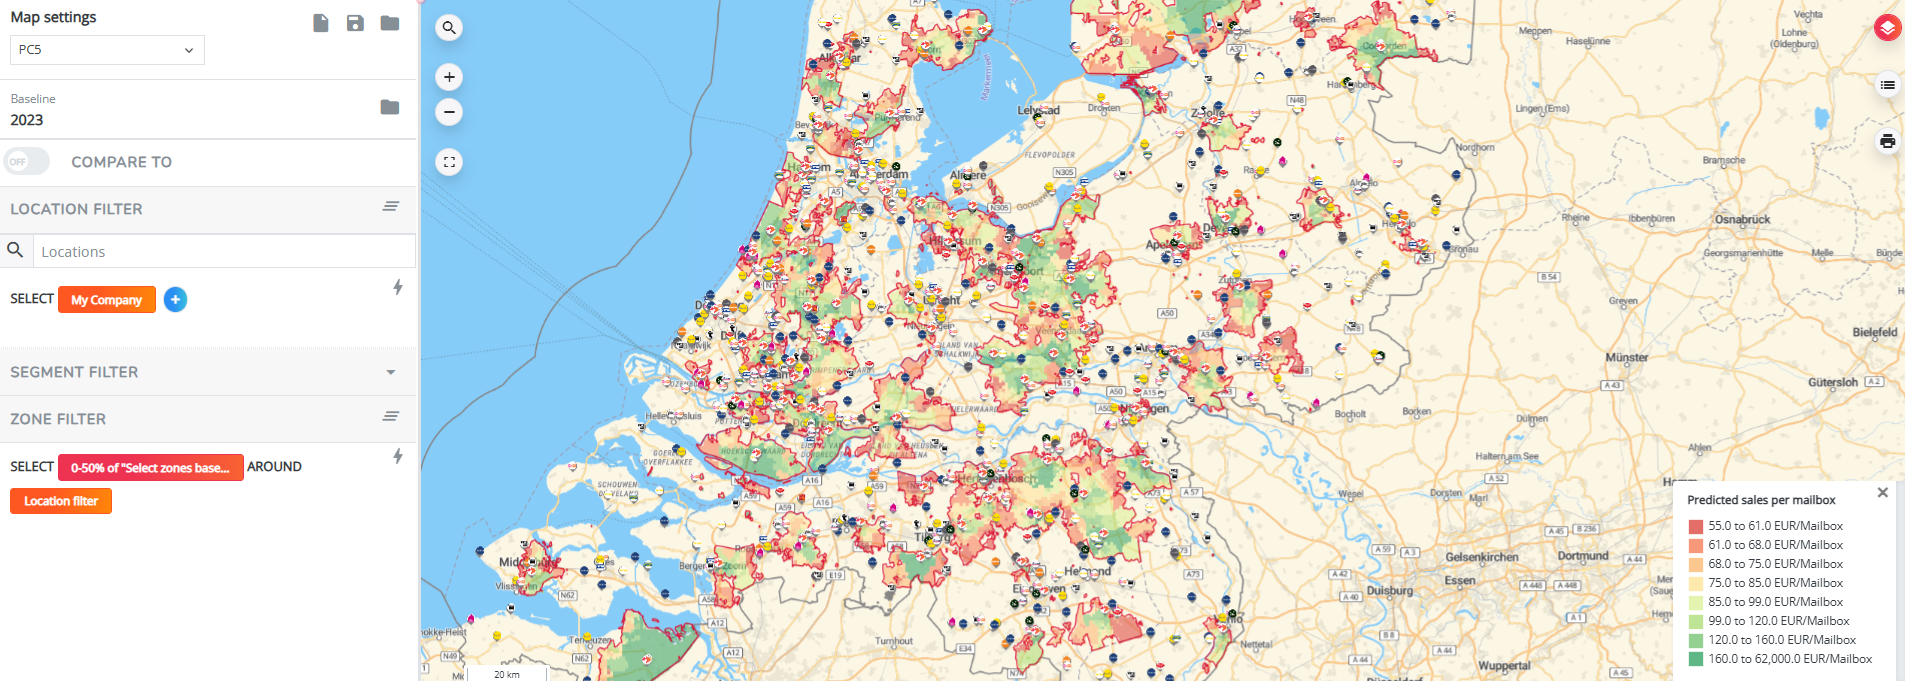
To obtain that selection of zones we first arrange all zones in scope of the country in descending order according to a configured predicted KPI. This KPI is our configured ordering rule. The ordering rule depends on the relevance of your industry and the type of marketing campaign. Examples of ordering rules are predicted sales per mailbox (leaflet), predicted market share (digital advertising), predicted sales per household... Now to reach that 50% predicted sales coverage, we collect all zones with the highest values according to the ordering rule (eg. predicted sales/mailbox) until we reach 50% of the total predicted sales (for all locations in the network)
This method is by default applied to all locations, but you can also only take the predicted sales coverage of one or several specific locations into consideration. Go to step 5 to do so, otherwise head straight to step 6.
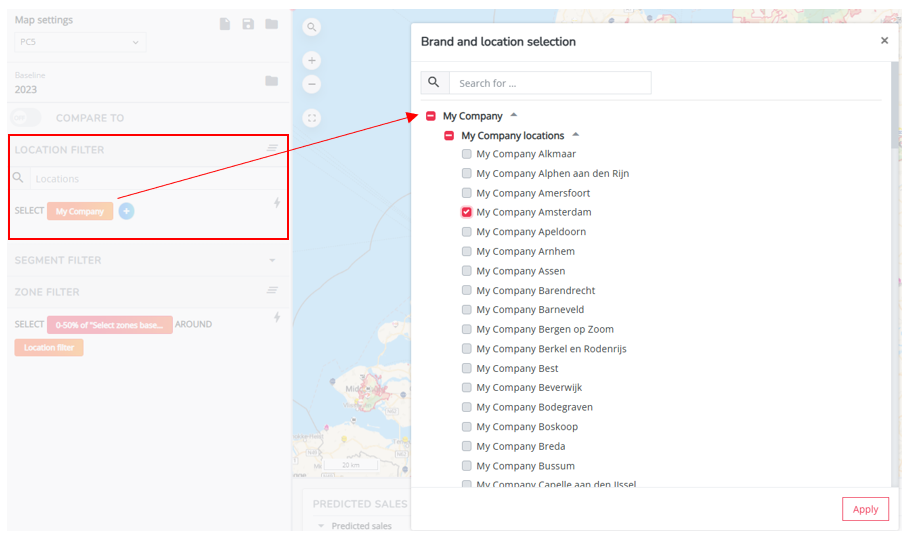
Step 5: Go to the location filter in the left settings bar and click on the orange filter button. Now deactivate your own brand (this automatically deselects all locations of your network) and select the checkboxes of the location(s) you want to do this for. Select apply to confirm your changes.
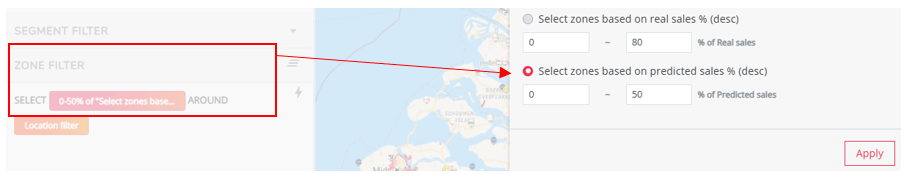
Step 6: The default sales coverage of 50% (according to the activation campaign zone filter settings) can still be adjusted according to your campaign budget or cost per zone. 50% covers roughly the primary and secondary catchment area of locations and could be used as a best practice for digital advertising campaigns. 25% or the primary catchment area on the other hand are best practice for leaflet distributions (more expensive medium).
Adjust the sales coverage percentage by clicking the red zone filter button in the left side panel and altering the number in the pop-up window. This percentage automatically applies to your chosen locations from step 6.
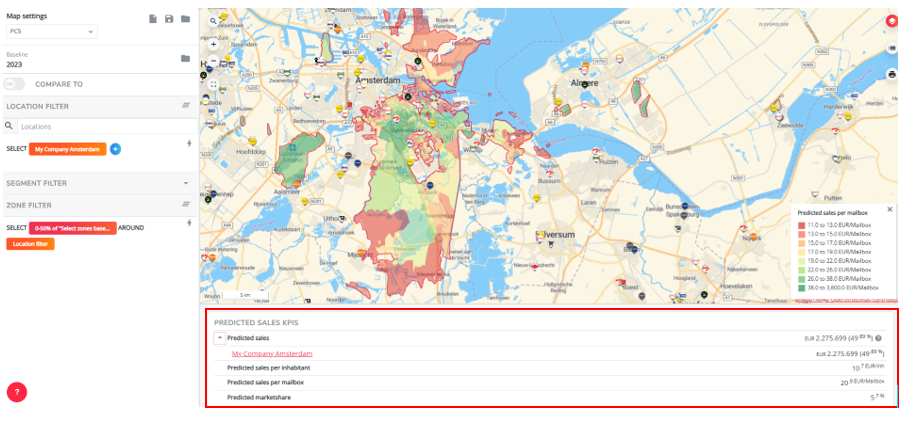
Step 7: Validate the resulting zones on the map. The selection now identifies the zones with the highest sales potential according to the defined coverage %. Below the map you can find all filtered data for this selection eg. the number of mailboxes (useful for leaflet distribution)...
TIP! Add or remove zones from the selection. You can do this by clicking on a zone outside/within the selection and selecting the include in/exclude from filter button in the pop-up (or use the keyboard shortcuts as described here). However, as the predicted sales are based on a gravity model that includes all parameters of a normal customer behavior, you should only do this if you have valid reasons (e.g. tax costs are high, many stickers in that zone or zone is serviced by another location).
Step 8: Click on the Export to Excel button (
Good to know: RetailSonar also has an expert solution for advanced local marketing purposes; ideal for optimizing distribution zones across your network or monitoring campaign impacts for a new and optimal local marketing strategy. For more contact, please contact support@retailsonar.com.