How to recover customers after closure or relocation (Marketing)
Closing or relocating a location is likely to result in the lost of some customers. However, leveraging a predictive model to assess the overall churn and evaluating recoveries from other locations is already an excellent first step. But what if you could map those customers with high risk of churning? Would you then not target them with tailored retention campaigns to recapture a greater share of lost sales within your own network?
This article describes how you can use the platform to identify the zones most affected by the closure. We will furthermore offer insights on how marketing should use this information to take effective actions and win back customers.
1. Prerequisites
If you have customer origin data (coming from loyalty cards, surveys, or customer files) this is essential for understanding the impact of a closure or relocation. Customers living near the closing site will be directly affected, so knowing their locations helps estimate potential losses if no retention efforts are made. Additional details like their age or digital profiles can further refine your targeting strategies.
Ensure that your loyal customers are accurately uploaded in your platform. By mapping that data, you can identify the regions most likely to be impacted and develop targeted strategies to retain them.
If you also have data on your online customers, it will provide even greater precision in your analysis. Even if they don’t live near the closed site, they should be included in your communication and retention campaigns. By incorporating this online data, you can create more effective strategies to minimize the overall impact and support all your customers during the transition.
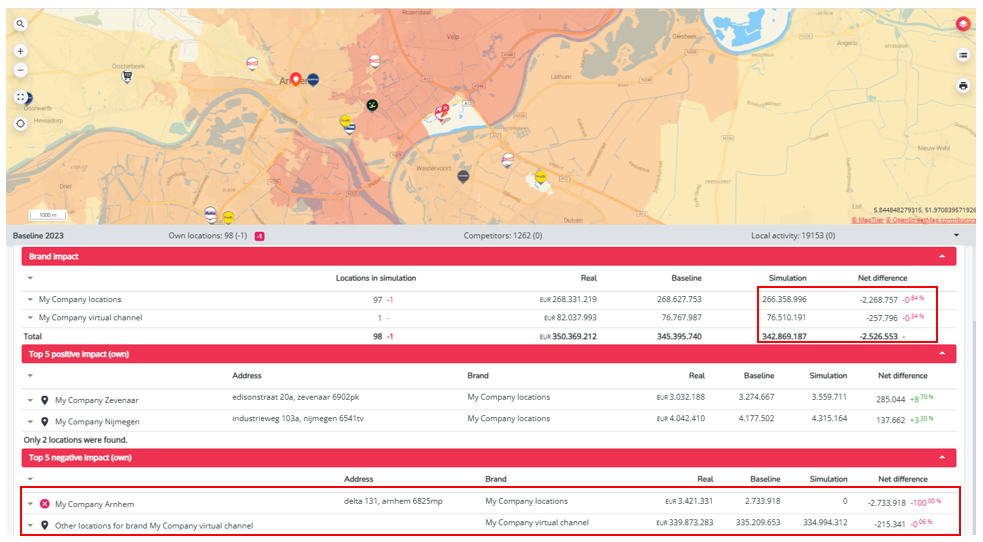
Step 1: Make sure you created & saved the closure (or local relocation) simulation in Location Planning. Read this article for more information on how to do this.
Step 2: Analyze the recuperation dynamics in the results section in Location Planning. Make sure you interpret the business case correctly.
2. Visualize high impacted zones on the map
Step 3: Go to Marketing Efforts.
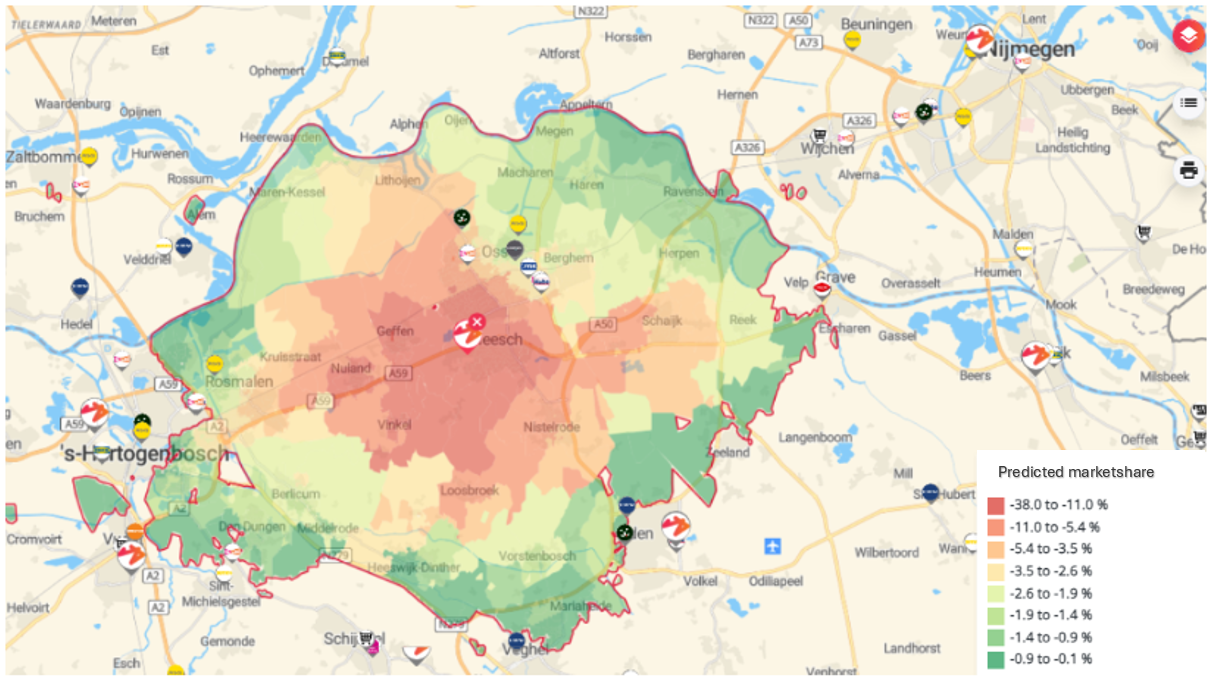
Step 4: To facilitate the exercise, we've already shared the right map settings you'll need for this usecase. You can load these settings by clicking on the map icon at the top of the left side panel and selecting "Retention campaign"
The settings we've installed (applied zone filter & map layer) are automatically applied to your latest saved closure simulation.

Good to know: You are not able to create the zone filter from the installed settings yourself (unless you're a super user). However, you can still swap the period and simulations to which the zone filter is applied.

Step 5: The map now highlights all zones where you will lose market share after the closure, corresponding to the applied zone filter. This is visualized by the delta map layer 'predicted market share'
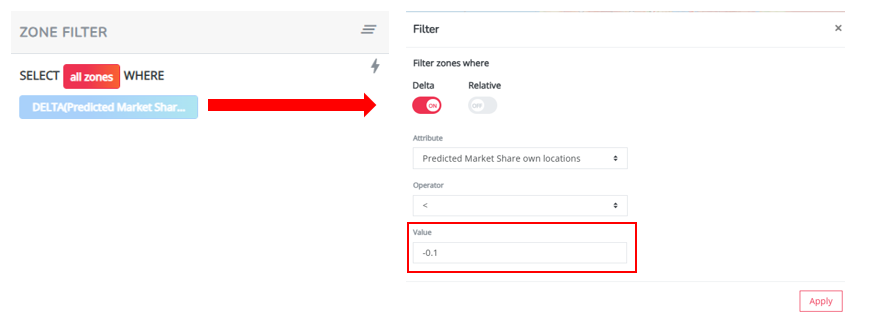
TIP! To visualize only zones that are heavily impacted, click on the blue button in the zone filter and edit the value field. For instance, you only want to visualize zones where the absolute market share has dropped with more than 10%, enter -0.1 (or -10% if the relative button is enabled) in the value field.
3. Implement the right retention strategy
We refer to the map presented above to understand which areas are at risk when closing the location. By analyzing these areas, you can determine which possible actions could be implemented to reallocate your clients. This map should be considered together with your internal client data, their digital consumption habits, their location, etc. Here are three main potential outcomes you can obtain, along with the strategies and measures you might consider to limit client churn.
- High risk of churn in zones where your predicted sales drop the most after closure (dark red zones)
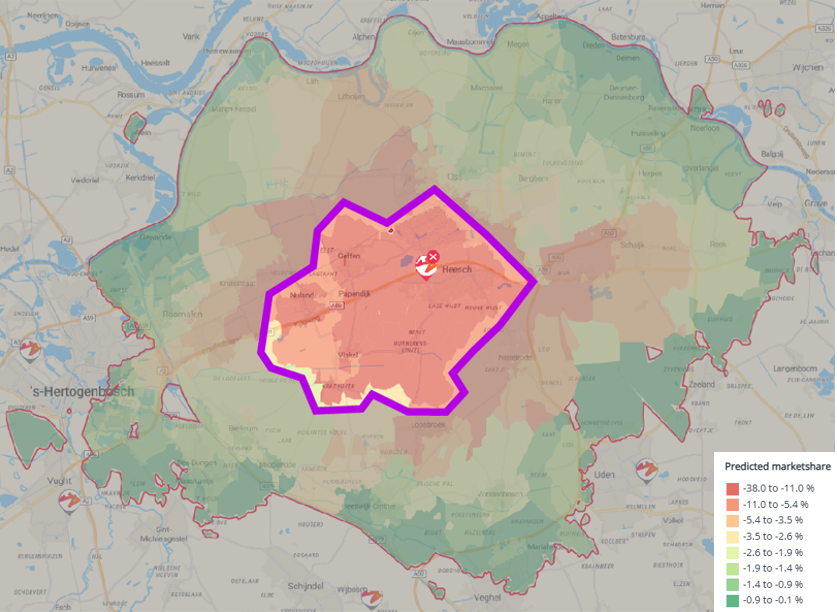
There is a notable decline in predicted market share compared to the baseline period, which significantly increases the risk of churning customers living in those areas. You might want to implement the right retention campaign to drive these customers towards your digital channels, cause there are no other physical locations of your network nearby. This may involve targeted communications, special incentives, or personalized support to facilitate their transition to online and reduce the risk of churn as much as possible.
- Moderate/low risk of churn in zones where the drop in predicted market share remains reasonable
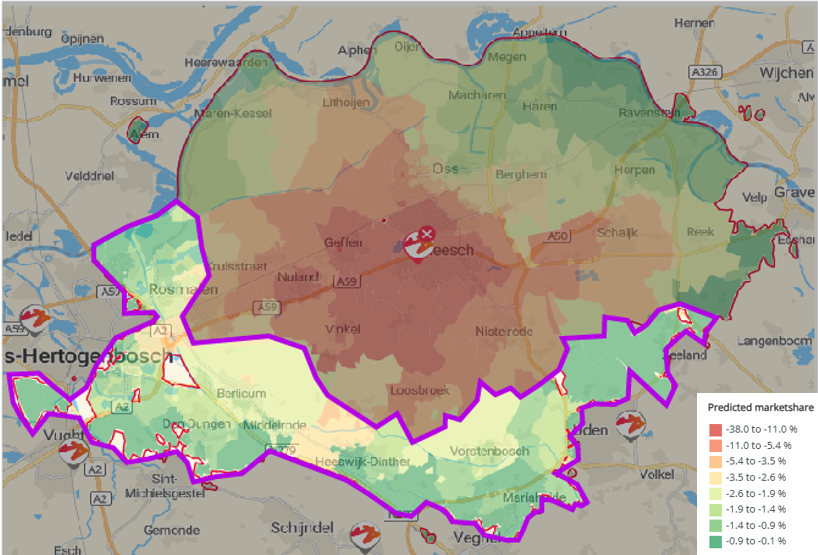
The decline in predicted market share remains within acceptable limits, indicating a lower risk of customer churn. However the risk is low, we would suggest to proactively inform your customers about alternative locations they can visit, or steer them towards your digital channels. By communicating the right messages here, you can help ensure a smooth transition and maintain customer loyalty.
- High risk of churn due to customers living far away from closed & remaining locations
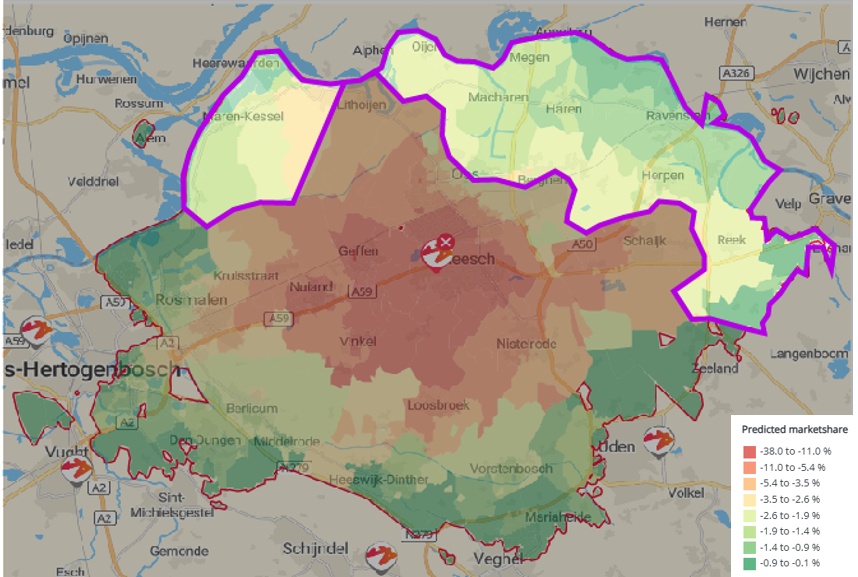
These zones are characterized by a low predicted market share both in the baseline and in the simulation, indicating that they are underserved areas. It is likely that customers from these zones work or go to school nearby the closed location, but do not live nearby. Consequently, as these customers are not covered at their home location, there is a heightened risk of churn in these areas. To address these customers effectively, implement a targeted retention strategy by guiding these customers towards your digital channels. This could include personalized outreach, tailored incentives, or enhanced digital engagement initiatives designed to retain them and ensure they remain connected with your services.
- High risk of churn in zones with low digital orientation
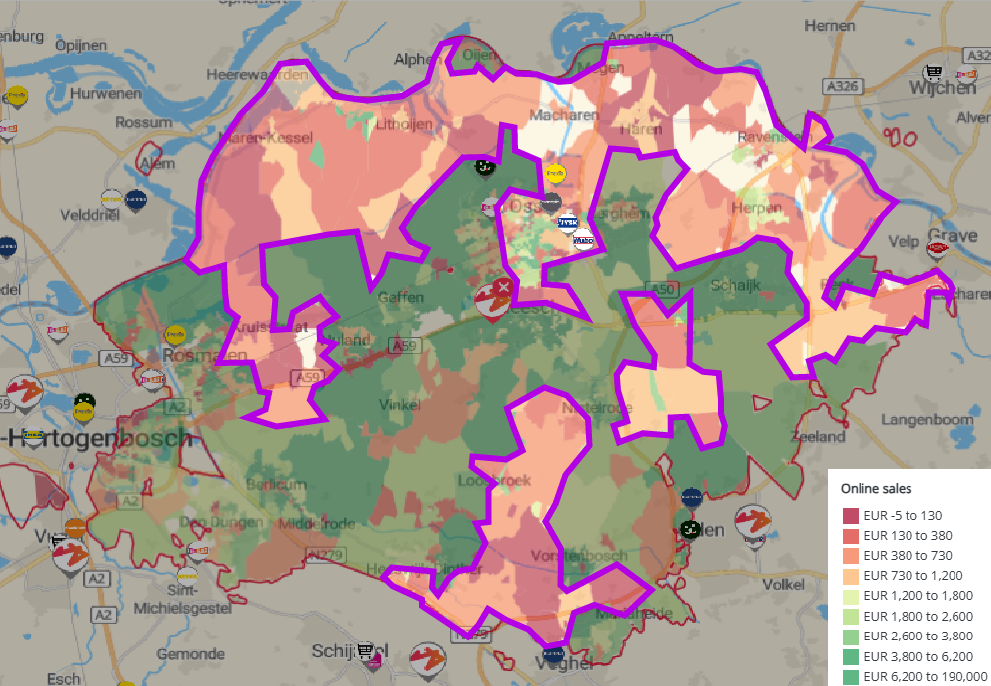
There is an extra risk on churn in zones with a low share of digital orientation, for these areas, it will be even more important to encourage your physical customers to shift towards your digital channels or to visit the nearest alternative store you own. By doing so, you can maintain their engagement and minimize the impact of the closure. Offering incentives, personalized recommendations, or exclusive deals can help facilitate this transition. Furthermore, clear communication and seamless integration between physical and digital touchpoints will be the key making this shift as smooth and appealing as possible.
Tip! When incorporating the online sales in the platform, the model results allow you to put the indicated risk of churn even more in perspective. By overlaying these insights, you can better understand how online sales might compensate for, or fail to offset, the decline in in-store transactions. This comprehensive view will help you assess the full impact of the closure and refine your strategies to optimize both your digital and physical presence. Additionally, these comparisons can guide you in targeting specific zones where online growth potential is highest.
Step 6. Download the right zone information for your your different retention strategies as mentioned above. Click on the Export to Excel button () and select the 'Retention campaign' export template. This templates automatically selects the relevant KPIs you will need to target the right areas. For more information on adding other KPIs to the export, refer to the Export to excel article.
Step 7. Evaluate and monitor the impact of location closures: if you were able to successfully redirect your customers and limit your customer loss, you can probably close more locations and work towards optimizing your future sales network.
Remark! If you need to analyze the impact of multiple closures within one simulation, this analysis can quickly become quite complex. Please contact support@retailsonar.com if you want us to help you with your case churn analysis.
