
Building simulations; step-by-step plan
After understanding the overview screendisplay in Location Planning, you're ready to use the functionalities to start building your business case or simulation.
Follow the steps in these order to make sure you've taking everything in account that is necessary for an accurate model result of your simulation.
1. Create a new simulation
Create a new simulation by first choosing the network you want to make location changes to. This is also how you can reset a previous simulation & start from scratch.
- Click on Start a new simulation (left icon on top in the settings bar) and select the most recent baseline period. TIP: for simulation calculations it's recommended to choose the most recent current state (containing the latest competition updates).
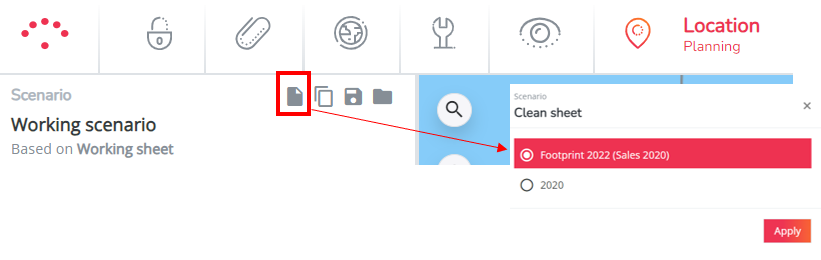
Remark. When you head to location planning, your most recent simulation will always be displayed. It's thus very important to create the habit of clicking 'starting a new simulation' if you want to create a new one. Otherwise you will create further on a previous created network changes and it will take combine effects into account.
2. Which simulations can you build & how to do it ?
Understand which simulations you can build & how to create these location changes:
- Closures of locations (own / competitor / local activity)
- Opening locations (own / competitor / local activity)
- Finding the address & dropping the marker on the map
- Validate the drivetime connection of the marker
- Correctly scoring location characteristics for new locations
- Consult this article for the full explanations on how to do this
- Relocating existing own locations
- Making location edits e.g. simulating the impact of changes in location characteristics
- Taking over competitor locations or vice versa; consult simulating takeovers
Consult Simulating local activity for the specific impact of local activity simulations.
3. Activate the predictive model
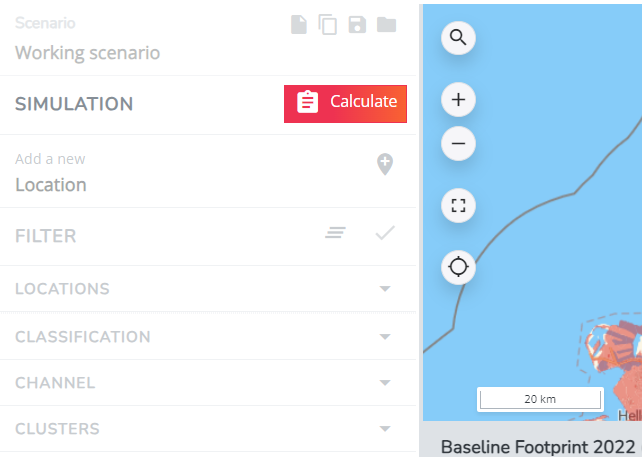
Making changes on the map doesn't imply that those changes are also automatically calculated.
Activate the predictive model by pressing calculate in the left settings bar (the calculation button will only appear when changes were made but not calculated yet!)
4. Reading & understanding simulation results
When you've calculated the results, the results section below the map will be readable. The results section contains the results for the combined effects of the different location changes you've made in the simulation.
TIP. In case you want to analyze the exact dynamics and impact of one specific change on the existing network, it's recommended to create one change per simulation. Results will be more straightforward to understand. You can still make a simulation with all changes combined to read the total brand and network impacts.
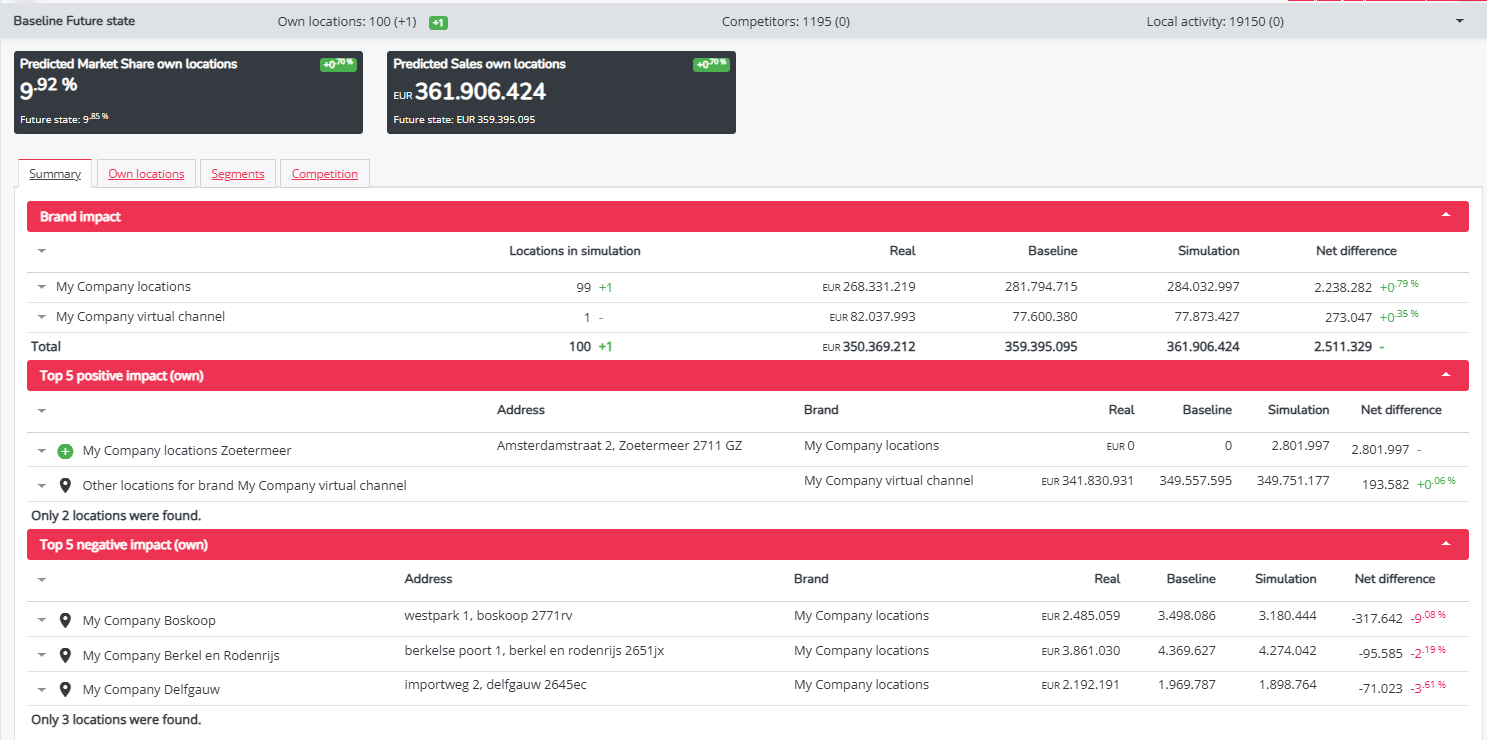
The black rectangles display the global predicted KPIs* after calculation of all changes. The green/red percentages show the growth / decline compared to the baseline network without changes. (* Different KPIs can be displayed in case of project relevance)
Below the black rectangles you can read the results in different tabs.
- Summary: includes a summary of the overall turnover impact on your brand (displaying the top 5 positive and negative internal cannibalisation dynamics), due the combination of location changes made in the simulation.
- Own locations: includes the full overview on the impacted locations of your brand, due the combination of location changes made in the simulation.
- Segment: includes an overview of the simulation results per segment (only relevant to consult if multiple segments are configured)
- Competition: includes an overview of the impact on the competitor network (external cannibalisation dynamics)
Read this to understand the different between the Real, Baseline and simulation figures.
The important simulation results are also included in the simulation location reports. Read the section below to know how to retrieve and export this.
In case you want to understand the predicted results better, it's recommended to read "Tips to help you interpret case results of new (own) locations"
If you want to grow these quick scan results into a final business case, make sure to read this article.
5. Exporting simulation results and/or location reports.
- To generate the automated location reports (by default configured on each platform) for a simulated location: click on the logo of the location for which you want to retrieve the report for on the map. (Be aware that there can't be a location report generated for closed locations.)
- In the location pop-up, select location view. The report will immediately open in a new tab.
- To save the report, click the right mouse button, select print (or ctrl P), choose save as PDF in destination.
- In the location pop-up, select location view. The report will immediately open in a new tab.

- To generate the custom reports (only possible when configured) for a simulated location: click on the logo of the location for which you want to retrieve the report for on the map. (Be aware that there can't be a location report generated for closed locations.)
- In the location pop-up, select reports. Next select the right template; the report creation will now start.
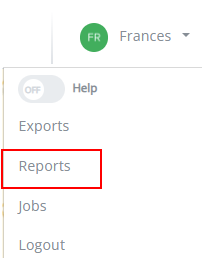
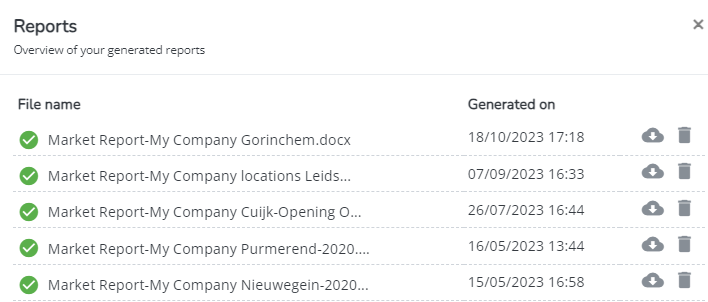
- When the report is finished, you can retrieve it from your user menu by selecting the reports section.
- The report is ready to download (select
) when there is a green check indicated to the left.
- The report is ready to download (select
- In the location pop-up, select reports. Next select the right template; the report creation will now start.

- To just export the figures from the results section below the map; click on the download to excel button next to the notifications icon. The export will be immediately available from your downloads (you will NOT receive a notification for this). The four different tabs will then be visible in your excel file in 4 different tabs.

6. Saving, sharing and managing your simulations
Simulations are never saved automatically, so be sure to hit the save button in case you want to retrieve this simulation a later time! Please consult Manage your simulations for all information.
TIP. It's recommended to save your simulations so you're able to upload it in the performance (for benchmarking purposes) and marketing efforts (for marketing action purposes) modules.