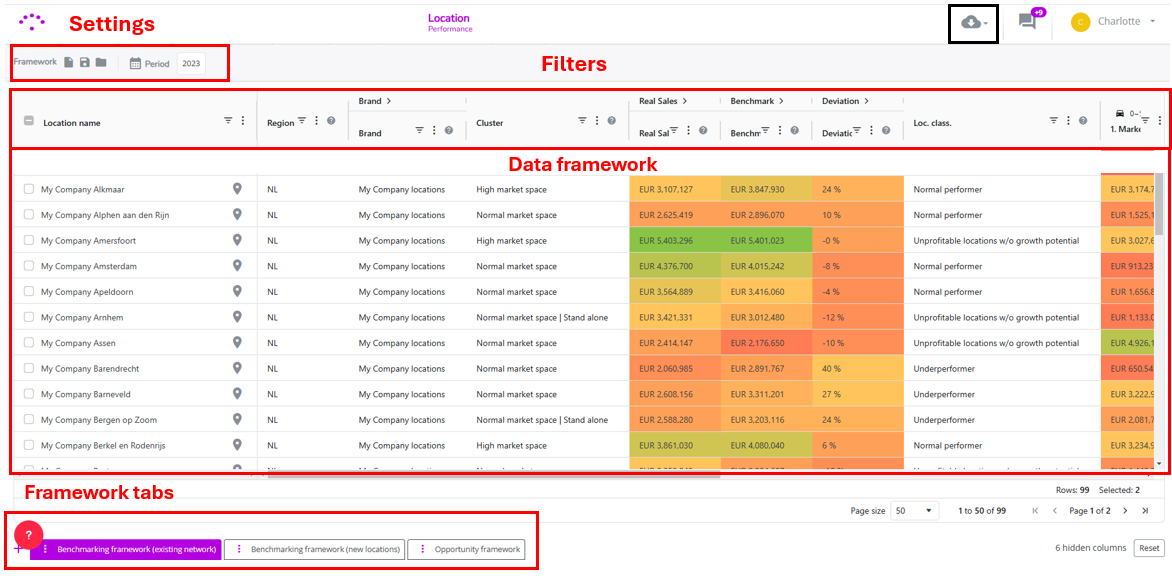
On the upper side of the Locations Performance Module you can choose the settings of your framework. Your settings will determine which framework will appear, which data will be loaded within the framework and for which locations.
Load the right framework by selecting the default framework*. This way you're sure you see the latest changes made by your consultant (usually occurs after every maintenance).
Save changes to the framework. Only relevant for super users who can create their own frameworks.
Load another framework (if configured) than the default one. (e.g. for another country or (sub-)brand)
It's only possible to configure one default framework - this one will be visible for all users by loading that default framework. Super users that are able to configure their own frameworks should contact our support team to copy their frameworks to other users.
The filter options
You can filter the list of locations displayed in your table by eg. location name, cluster, sales values, location classification or any other relevant value of any column to benchmark your network. To find out more about how to set up a filter, we invite you to consult this article. Filters enable you to perform more relevant benchmarking.
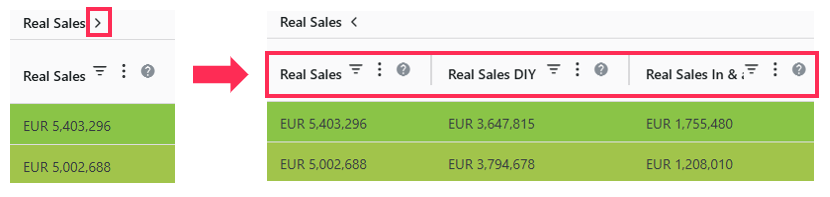
Some column headers group together several sub-columns, allowing you to obtain more data on a main building block. These secondary columns can be displayed by clicking on the arrow next to the main column name.
In the example below, the main column “Real Sales” is made up of two secondary columns: “DIY Real Sales” and “Real Sales In & Around the House”. These secondary columns provide the sales achieved in the various segments that make up the overall “Real Sales”.
The data framework
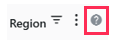
The table displayed is the result of the settings (and/or filters) you chose earlier, such as the data period and the various filters you may have applied from the column headings. If you want to know more about the exact meaning of a column header or sub column and you see a question mark next to it, you can hover your mouse over the to obtain a short description (or long description by clicking on it)
(Re)organize the table:
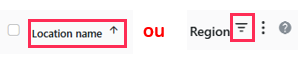
By sorting the values in a column: Click on the column name of your choice to sort it, or use the three dots to sort the values from highest to lowest or lowest to highest (also works in alphabetical order, or vice versa). By default, the location name column is sorted alphabetically.
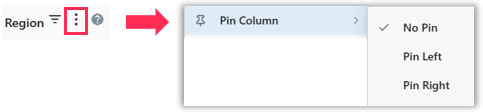
Rearrange the order of displayed columns by dragging and dropping the column of your choice to place it wherever you like in the table (more to the left or right). You can also pin a column to the first/last position in the table by clicking on the three small dots after the column name, then on “Pin Column” and finally on Pin “Left” or “Right” to choose which side of the table it will be pinned to:
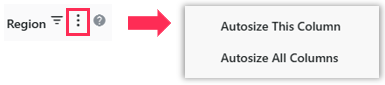
Automatically adjust the size of the column(s) by clicking on the three small dots after the column name, then on “Autosize this column” (to adjust only this column) or on “Autosize all columns” (to adjust all table columns):
To hide/redisplay columns, click on the three small dots after the column name. This will open a panel containing all the configured columns and their sub columns, indicating whether they are displayed or hidden :
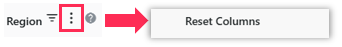
Note: You can reset all the choices previously made in the table by clicking on the three small dots, then on “Reset Columns
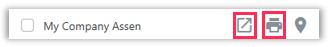
View and export a location:
Use the first icon to open the location view report. Simply click on the icon on the left that appears when you hover your mouse over the location name.
If custom reports have been enabled, click on the print icon to start downloading the custom report.
Framework tabs
Your default framework consists of several tabs, each displaying a fixed structure of columns with (calculated) KPIs. Select the framework tab that displays the data collections you want to display, to come to the right insights.
Tab names and configurations may vary from platform to platform, but most platforms will have our best practice configuration as displayed above. Each tab has a different purpose for benchmarking. Read this article to find out how to read the above framework tabs and which insights they expose.
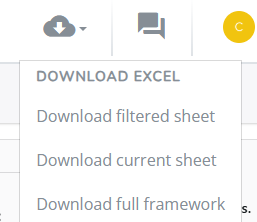
Export
There are different export capabilities available in the Location Performance module to give you more flexibility and insights into your data. You can choose between three export options:
Download filtered sheet – export only what's currently filtered
Download current sheet – get exactly the sheet which you’re viewing
Download full framework – export the full framework with all metrics
These options make it easier to extract exactly the data you need for reporting, sharing or further analysis.

Load the right framework by selecting the default framework*. This way you're sure you see the latest changes made by your consultant (usually occurs after every maintenance).
Save changes to the framework. Only relevant for super users who can create their own frameworks.
Load another framework (if configured) than the default one. (e.g. for another country or (sub-)brand)

or hidden
: