
Analyze the performances of your locations and identify underutilized locations
As a retailer, ensuring optimal performance across your locations is crucial. How can you assess whether each location is maximizing its revenue potential? This article will help answering the above question by guiding you through the platform. It will help you understand and evaluate your locations' current performances and identify underutilized locations.
> Go to the next case to pinpoint the right growth opportunities and consider real estate solutions for those underutilized locations.
1. Benchmarking your current network
Step 1: Open the Location Performance module to access the configured performance framework(s).
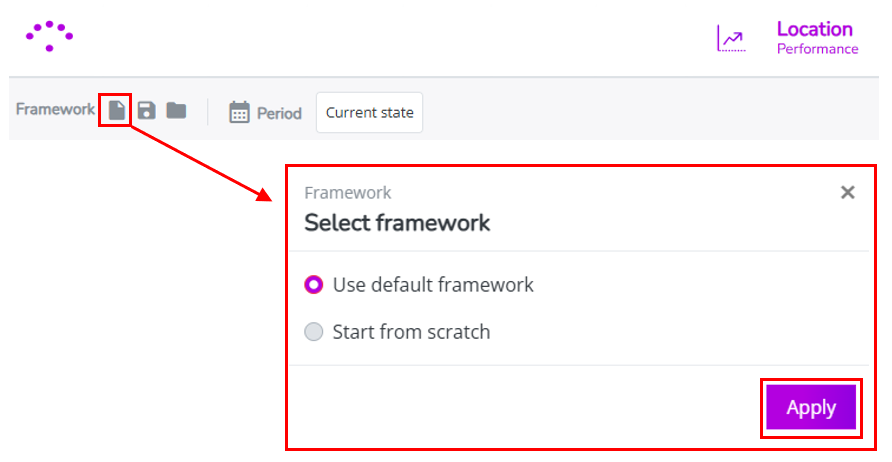
Step 2: Click on select framework in the left upper corner and select the default framework. This ensures you are viewing the latest updated changes done by your consultant. (Don't forget to do this after each yearly platform maintenance.)
Step 3: Again in the left upper corner, make sure to display the latest sales data for your current network. Therefore select the most recent uploaded baseline period.

Step 4: At the bottom of the screen on the left side, select the benchmarking framework (existing framework) tab, usually displayed by default.
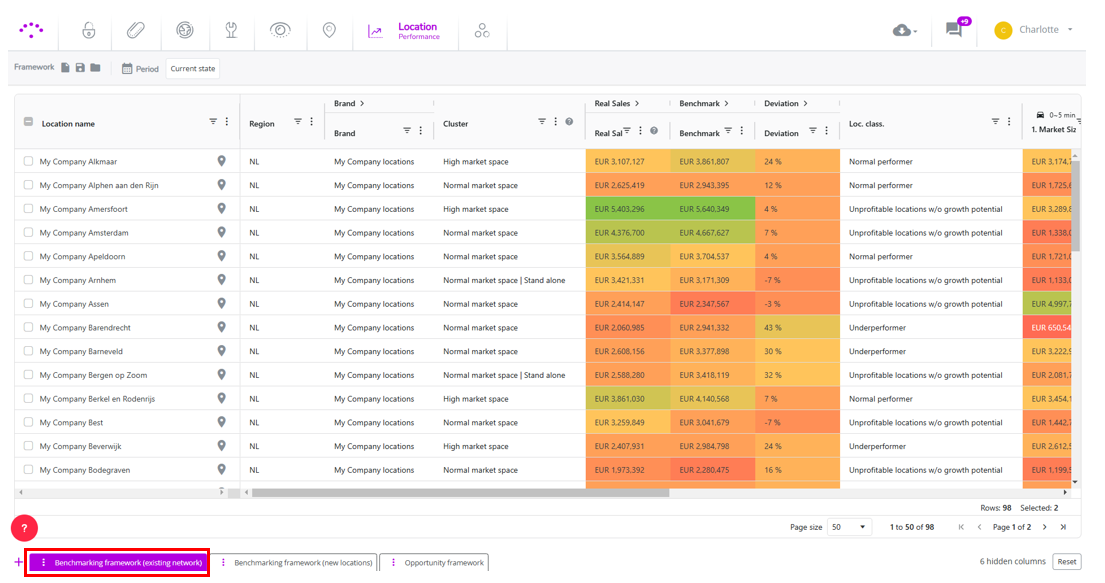
Step 5: Now you can assess the benchmark of each location. Make sure to analyze the columns on the right to understand why the benchmark is so high or so low. The columns right from 'location classification' display the models' building blocks and the drivers of the benchmark.
- Analyze the macro environment numbers per catchment area to understand whether there is enough potential in the larger catchment area to justify the presence of a location. The macro environment takes into account the market size, the competitive pressure and the willingness to travel (displayed by the catchment area).
- Analyze the location characteristics to understand to which extent the location will be capable to attract the market space. Click open the 'location correction' column to see all visibility, convenience and experience values. Note that 100% is neutral, <100% means a negative correction, >100% means a positive correction on the attraction of the market space.
Remark: The predictive model is a customer-centric model and operates in an advanced way. This implies that benchmark calculations are not limited to the 3 catchment areas, although you only see primary, secondary and tertiary results displayed within the framework
2. Identifying underutilized locations
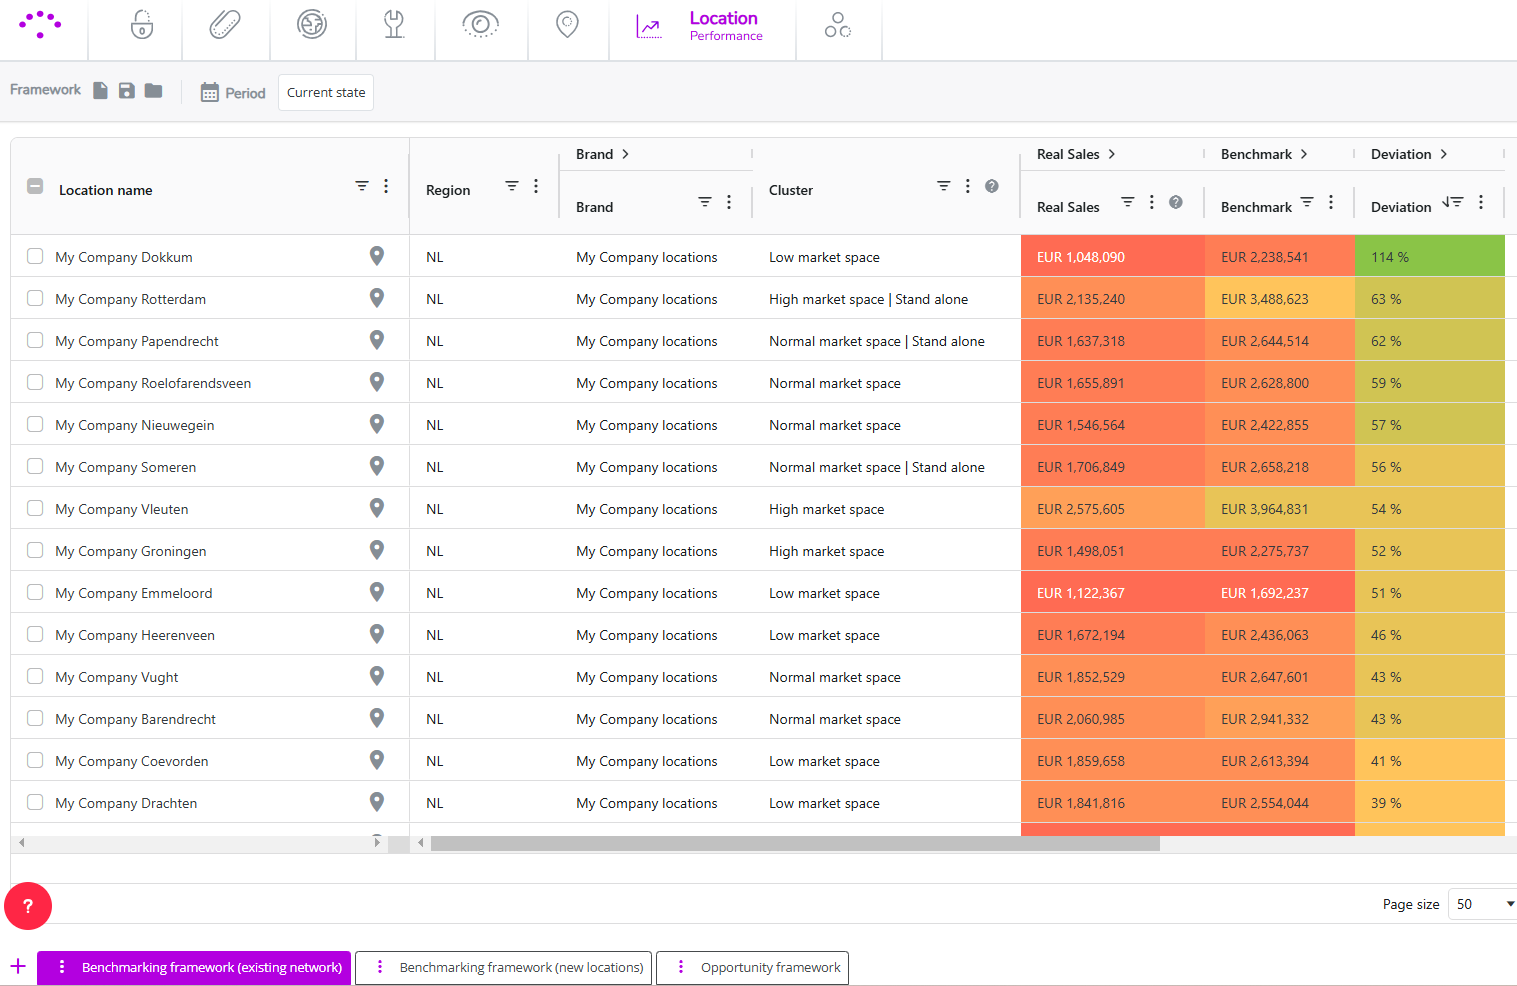
Step 6: You can now compare the benchmark with the current performance of each location. Go straight to the Location Classification column to identify locations that have a large deviation from the model result. You can sort the deviation column from high to low by clicking on the column name to have an immediate view on this.
The following classifications are interesting to validate and define actionable strategies for:
- Underperformers: current sales are significantly lower than the benchmark => for these locations you should investigate growth opportunities.
- Unprofitable location w/o growth potential* (*only when margin figures are known and uploaded): unprofitable locations for which the current sales are in line with the benchmark => for these locations real estate possibilities should be explored.
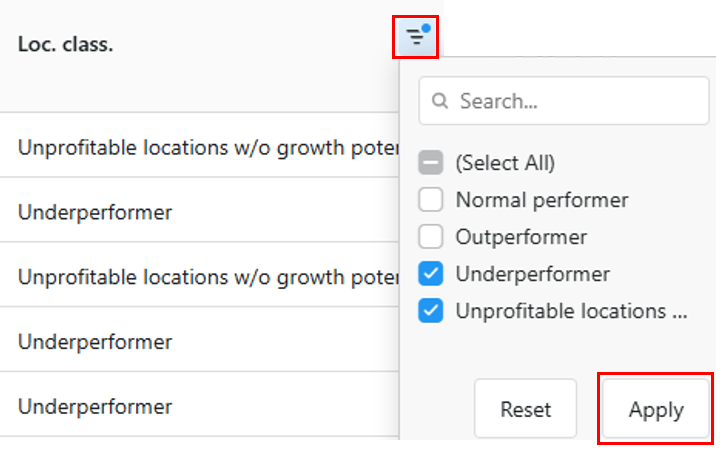
TIP! Use the location classification filter for an overview of these locations only. You can do this by clicking on the

Step 7. Before exploring possible next steps for these locations, assess whether the data and the local environments that have an impact on the benchmark is correct. Do this for each location within these groups separately by analyzing the Location View reports. You can open the report by clicking on the icon right from the location name in the framework.
Validate these 2 questions in the right sections of the report:
- Are the location characteristics scored correctly for the underlying location?
- Are the competitors and local activity correctly mapped ?
In case the answer is NO to one of the above questions, this might have an impact on the predicted benchmark. Therefore the correct data should be updated for the given baseline period in Data Management*. Once the changes have been implemented, a new benchmark will be calculated and visible in the framework. Make sure to repeat step 2 from this flow to see the latest changes!
*Only possible for users with a specific user role.