
How to test a specific new charging location on the predicted potential
If you need inspiration of which locations to test in a search area, please click here.
In general, the testing of a specific new charging location on the predicted potential is done in 4 steps:
1. Find the location on the map
2. Create the new (own) charging location and validate all location characteristics
3. Validate the local environment on completeness of the market data
4. Build the report
Note, consult all the details of the methodology in our technical report.
1. Find the location on the map
- First, go to the Location Planning module
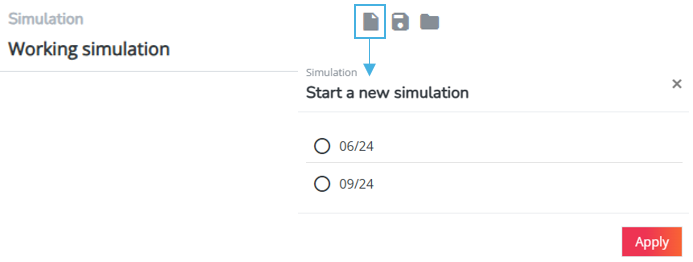
- Click on start a new simulation (left icon on top in the settings bar) and select the baseline period on which you want to build your simulation.

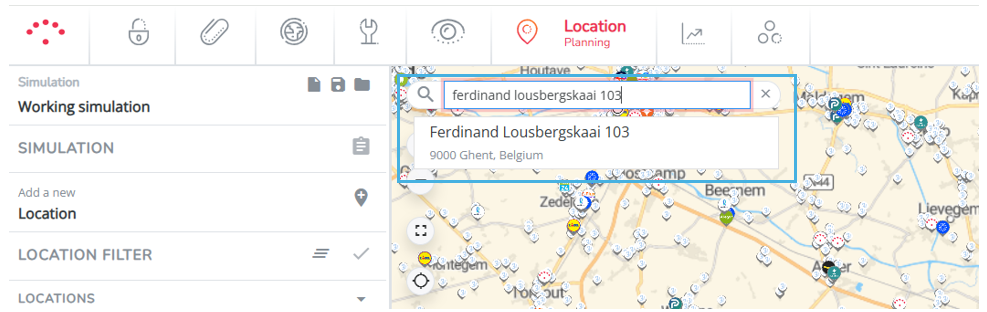
- Next, click the search button on the map in the upper left corner. There are two interesting options to find the right location immediately from here:
1) By filling in the address (as complete as possible) as shown below. The application will see if this address can be found on the map.
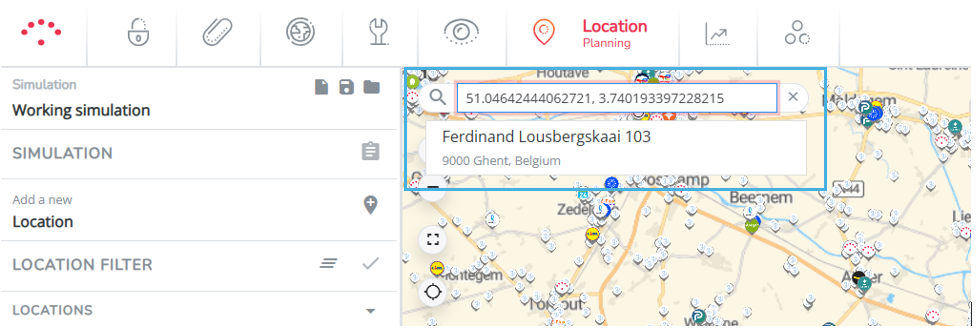
2) By filling in the geographical position with latitude and longitude. If you have these coordinates available you can fill them in according to the format as shown below:
2. Create a new (own) charging location and validate all location characteristics
To do this, follow the steps below:
2.1. Create the location
If the orange marker that appears from step 1 is the exact correct location, you can click on the orange marker to confirm and to automatically open the location pop-up window.
In case you have issues finding the address with the search bar, you can always use the 'new location marker' from the left side panel and drag&drop it on the map. A pop-up will immediately open where you can enter all needed information.

2.2. Indicate the type of the new location
Fill in the characteristics as shown below:
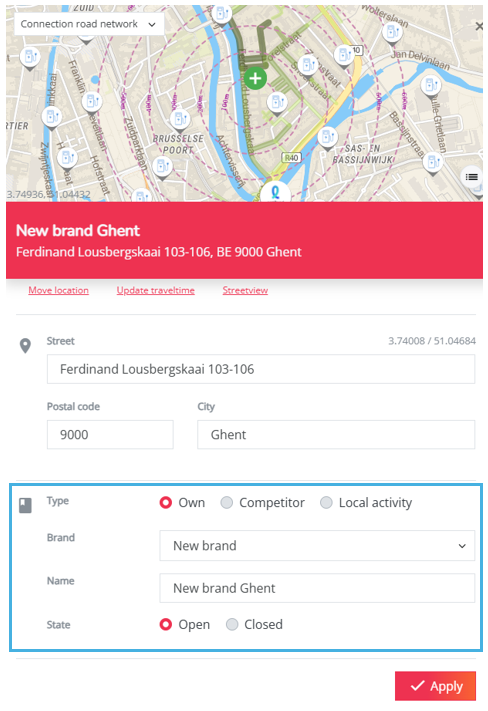
- Type: Select "Own"
- Brand: This should automatically be filled with your own brand.
- Name: Give the location a name. This is typically the brand and the name of the municipality. This name will also be used in the reports in a later stage.
- State: Select "Open" here to ensure that this new location will be taken into account in your calculation.
Next click on the Apply button and wait a few seconds until the pop up window is shown again.
2.3. Validate the road snapping
You can do this on the mini-map on top of the pop-up window, displayed by the map layer connection road network.
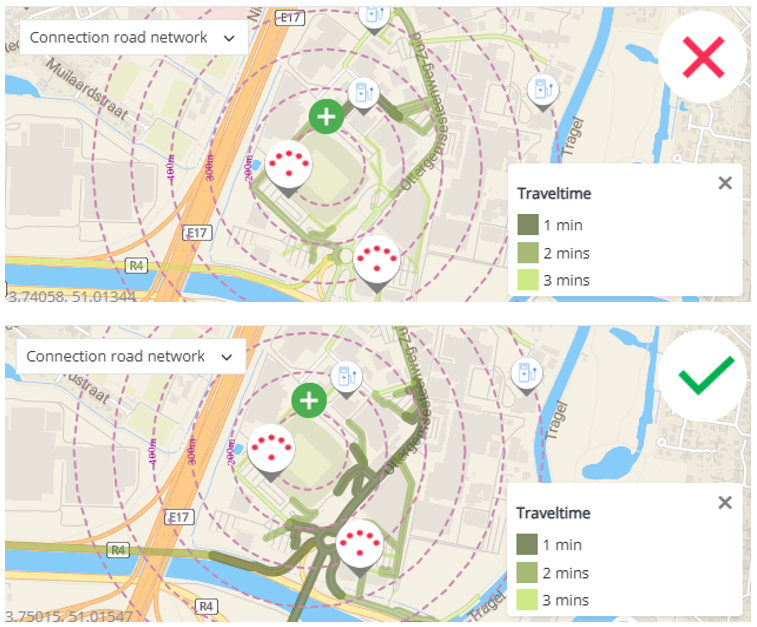
Verify if the location can reach the right road segments within 1 min car drivetime. This is important to be sure that the application connected this new location correctly to the road network. If you would see that the connection is not made right, then you can update the travel times by selecting a different road segment to start from. You can then for example choose the road segment where the entrance of the site (the shopping center entrance given the charging location will be clearly indicated) is located.
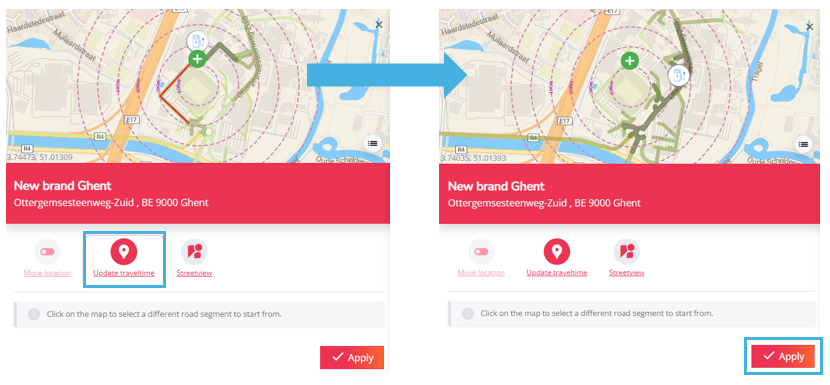
If you need to update the travel times, you can use the 'update traveltime' button as shown below. A textbox will appear "click on the map to select a different road segment to start from". Click on the correct road segment (on the minimap) for the new snapping of the traveltimes. A red line will appear on the clicked road segment. Click Apply to finalize the new traveltime snapping.
2.4. Indicate and validate the other location characteristics
You can now scroll below the fields you've already completed to indicate or enter the right values for all location characteristics.
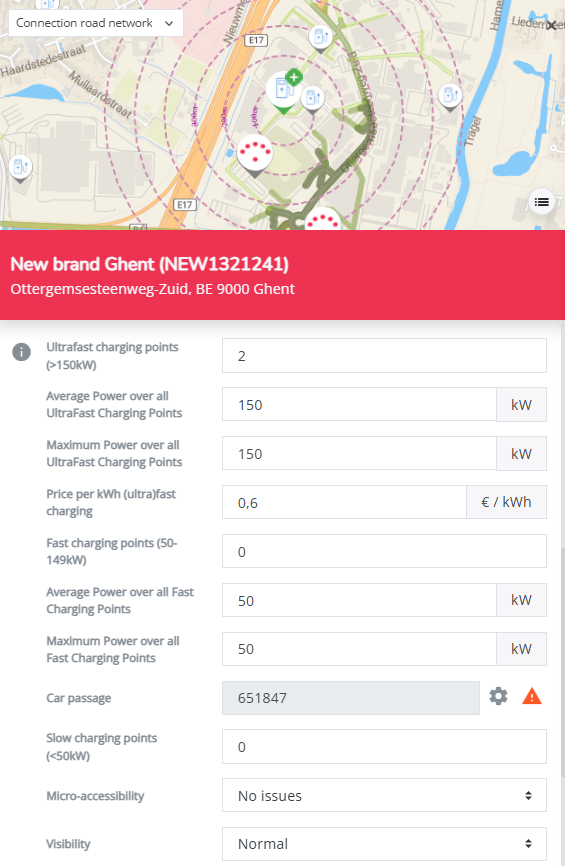
Below an overview of all location characteristics that should be evaluated with care:
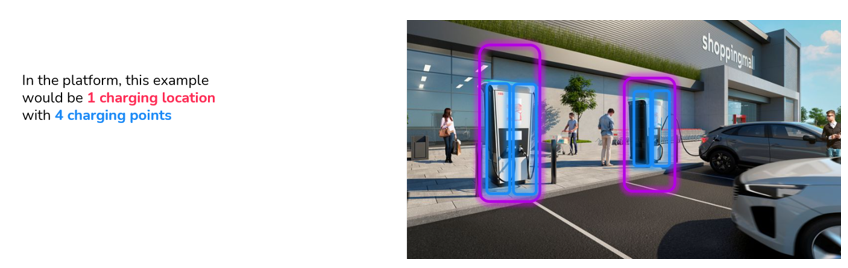
# charging points per type (in function of power classes)
Fill in the number of charging points (or guns or parking spots) per power class. For the example below this should be 4 charging points:
Average power of all chargers by type
Indicate the average power of all charging points on the location by power category (fast, ultrafast)
Maximum power among all chargers by type
Indicate the maximum power of all charging points by power category (fast, ultrafast)
Price per kWh (ultra) fast charging
Indicate the price per kWh for the location
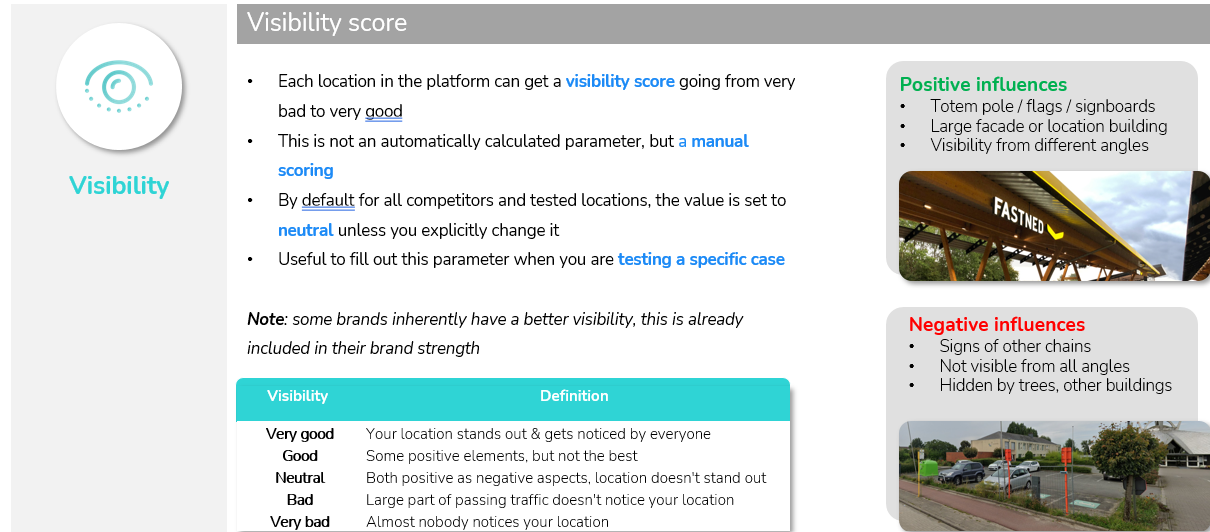
Visibility
Here you can score how visible your location is for the car drivers nearby. Below some explanations on how to give a score.
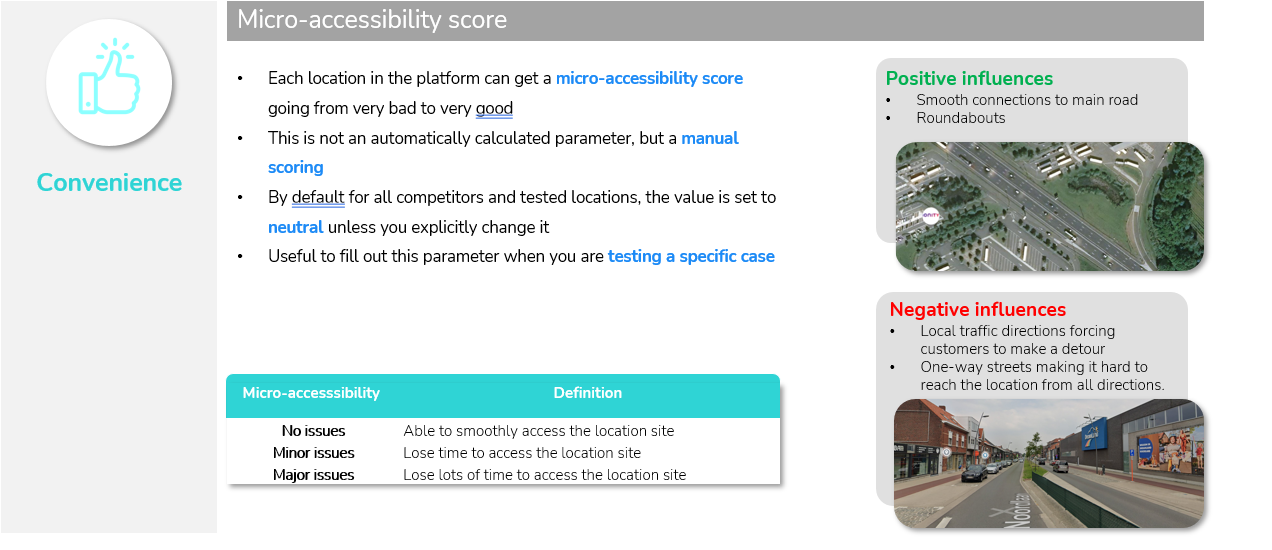
Micro-Accessibility
Here you can score how easily accessible your location is for the car drivers that are entering your site
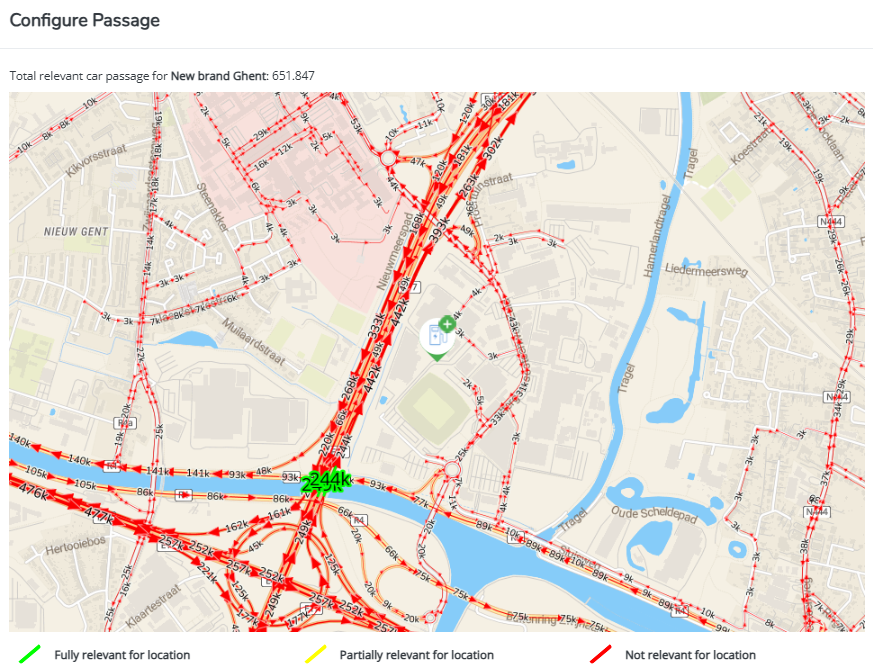
Car passage
This parameter indicates the number of cars per week that pass the environment and from which your location can capture passing EV drivers.

By default our algorithm will select up to 4 most relevant incoming road segments for your location (based on a 3 minute isochrone, taking into account local traffic congestion situations).
Since the default algorithm may have very occasional setbacks, it is recommended that the user validates and if necessary adapts the relevant road segments for a location. This can be done by clicking the cogwheel icon:

This now opens the passage configuration window:
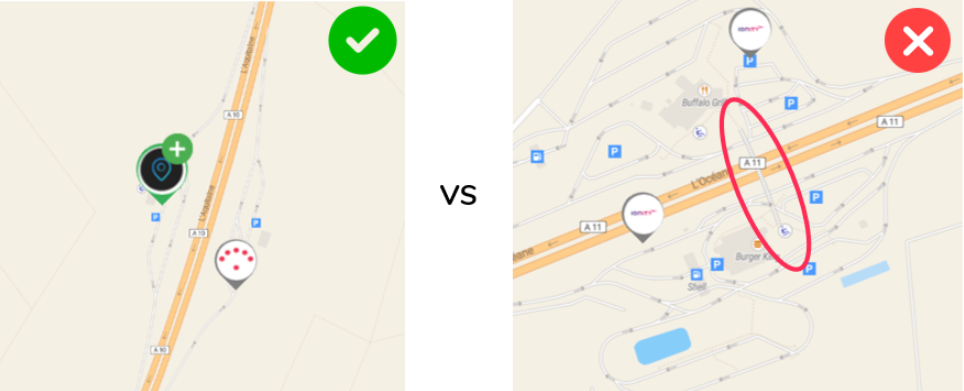
The rules we recommend to take into account are:
- Do not select two subsequent road segments. You want to avoid that the same passers-by are counted double
- If a competitor of you is located more closely to the primary road axis, you can make a corrections so that only a fraction if the passage is considered relevant for your location. We recommend to:
- Consider only 40% of the passage as relevant in case 1 competitor is located more closely to the big axis
- Consider only 20% of the passage as relevant in case 2 competitors are located more closely to the big axis
- Consider only 10% of the passage as relevant in case 3 or more competitors are located more closely to the big axis
More information on how to use the passage configuration window to select the relevant road segments for car passage can be found here
3. Validate the local environment on completeness of the market data
In this step it is important to check if all relevant local activity and charging locations are up to date.
3.1. Check if the local activity is complete and add missing activity yourself
Local activity can be validated by selecting the layers Local activity < 30min and Local activity 30min-2hours on the map. If you notice certain points of interest are missing in your application, you can find the steps to add them here.
3.2. Check if the charging locations in the environment are correct and up to date
Competition can be validated by selecting the layer "Locations" on the map. All charging locations that are taken into account for the simulation are shown by means of clickable markers. If you notice certain competitors are missing in your application, you can find the steps to add them here.
If you know that a competitor or own location will be opened at a certain location in the future, you can add this information for all users to your platform as described here.
3.3. Precautions for highway locations
Before applying this rule, make sure that the competition around your location is up to date and that no relevant competitor has been omitted. In some cases, a competitor may be located on the other side of a highway without a direct crossing. Since this competitor cannot be reached from the same side of the highway, it does not represent real competition and should therefore not be considered in our simulations.
Steps to follow:
- Check the accessibility of nearby competitors and identify those located on the other side of the highway without direct access (no bridge, underpass, or nearby interchange).
- Exclude these competitors by setting their status to closed to prevent them from influencing the analysis. Click on the relevant site, then on the Close icon in the location pop-up. It will appear with a cross indicating its new status
.
- Run the simulation with these adjustments to obtain a more accurate estimate of the potential of the tested location.
This approach ensures a more relevant analysis by considering only competitors that are actually accessible from the studied location.
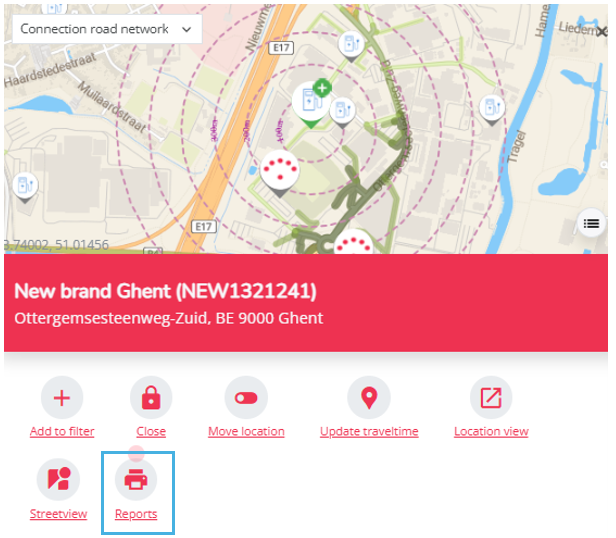
4. Build the report
To download the report, you need to click on the new location logo on the map. Next, select the Reports button. A pop-up window will appear allowing you to select your preferred download format.
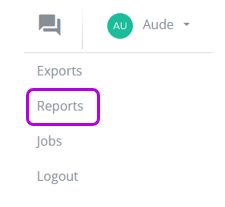
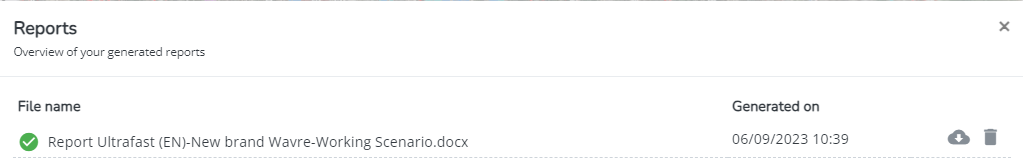
Once the report has been generated, you can access the report under your username (top right) in the Reports section.
When the report has finished loading it will have a green completed icon. You can then download it by clicking on the export button.
If you are exporting a report for the first time, this section may not appear. To resolve this, refresh your browser page by clicking on the F5 key on your keyboard (alt + F5 keys on some computers), or on the refresh tool at the top left of your browser (
on Google Chrome and Mozilla Firefox).
All reports will be saved here for an unlimited time.
Once it's downloaded, you can open the report and start exploring the different sections, such as:
- The different potentials (market, road flow, etc.)
- Competitive pressure
- Analysis of the micro-environment around the location
- Detailed results of expected cannibalization in the environment, annual consumption and expected catchment area
You can also use the report as a starting point to estimate the investment cost. The distance to the high-voltage grid can be a good indicator of how high the costs will be.
You can watch a video here, which gives you an example of how to open a charging location with the main steps to follow :