
Overview screen display Optimize
DISCLAIMERS
- This module is exclusively available for Super users.
- When a user starts a batch calculation in the Optimize module, the data management module will be blocked for all users. Everyone will receive a notification saying that user X is running an Optimize exercise, with a progress bar that shows how long the Optimize calculation will take (cfr. Step 3)
- You can use the location planning module when running an optimize project.
- You can run multiple optimize projects at once, all should make progress.
- In the optimize module all locations are tested as a N+1 simulation and thus not as a combined simulation. This means that the predicted potential of the locations are calculated as if each location is opened 1 by 1. However, it will be possible to afterwards open a selection of locations together in the Location planning module, and thus have a combined simulation after all. This enables you to see the combined impact on your network of opening all the locations at once.
Screen display & functionalities
The Optimize module enables you to test the predicted potential of a full list of locations in a more automated way.
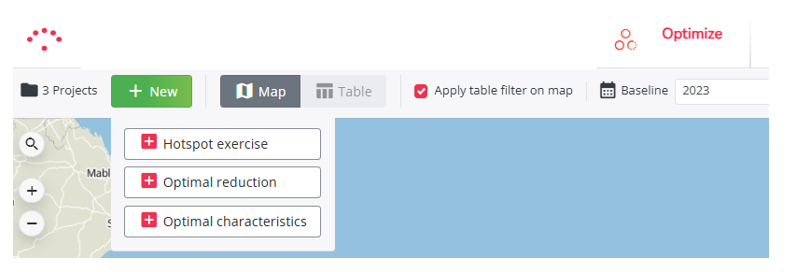
You can choose from three types of projects to get started:
- Hotspot exercise
- Optimal reduction
- Optimal characteristics
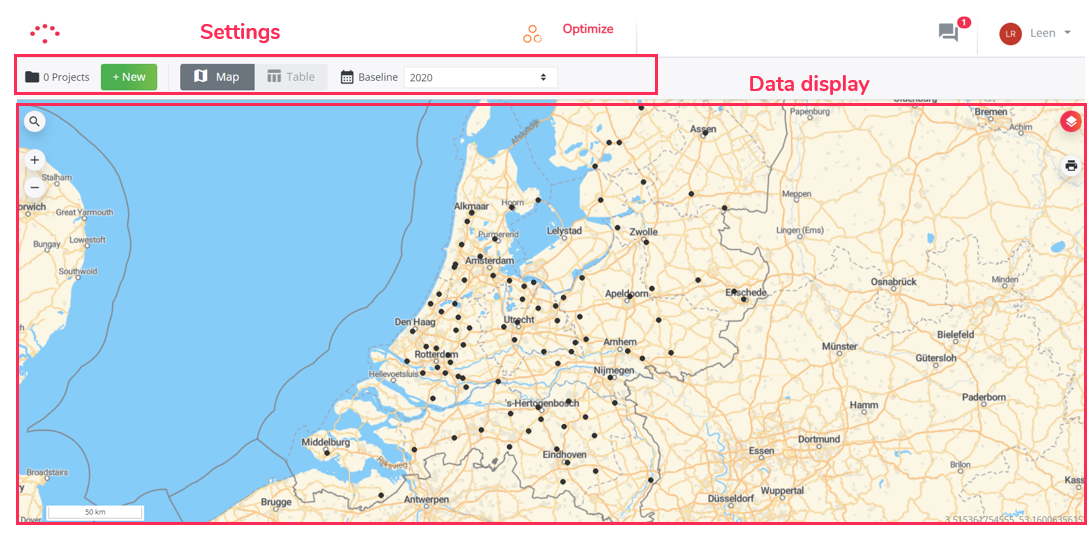
Settings
- Create a new project
- Load previously created projects
- Option to display the results on the map or in a table
- When ‘Apply table filter on map’ is selected, the map will reflect the same filters applied to the table
- Select which baseline you want to visualize


Data display
You can use the map almost the same way as in Marketing Efforts. By applying specific map layers 
(Scroll to the 'Interactive map' section in Overview screen display marketing efforts).