How to display the car passage or footfall ?
When the car passage or footfall datapack is enabled on your platform, you can investigate the road segment passage for each (main) road segment in the country.
Follow these steps:
Step 1. Go to Marketing Efforts.
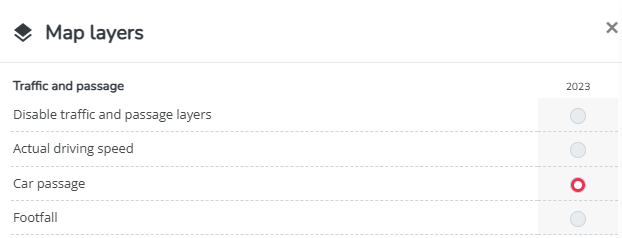
Step 2. Click on the map layers button in the upper right corner of the map and enable the "car passage" map layer.

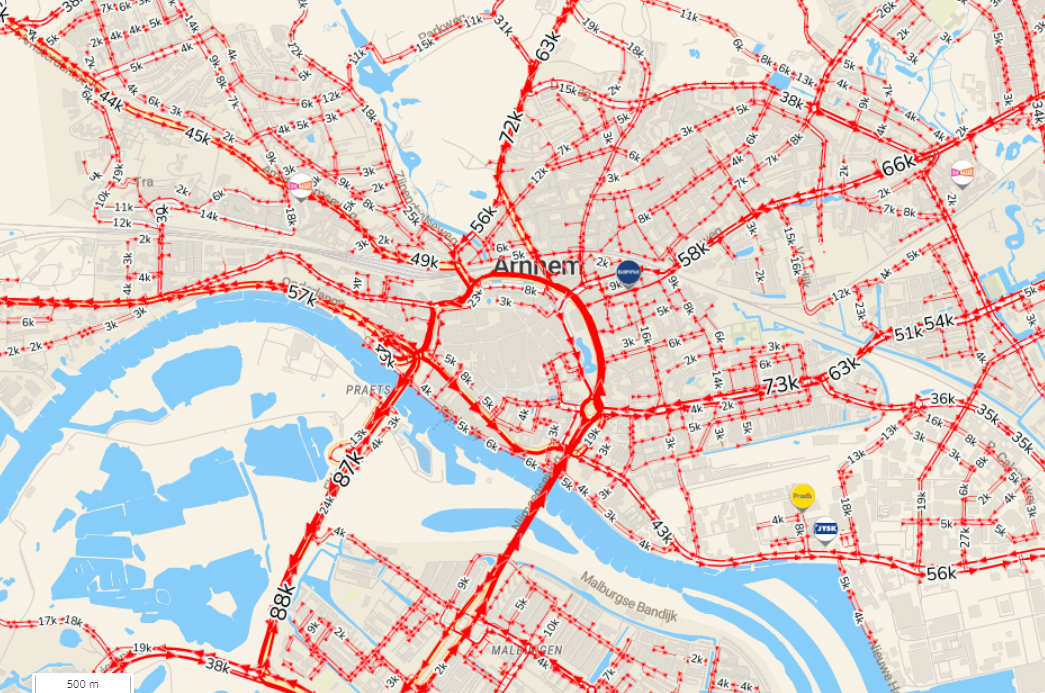
Step 3. On the map, zoom in on the road segment of interest until you see the numbers displayed.
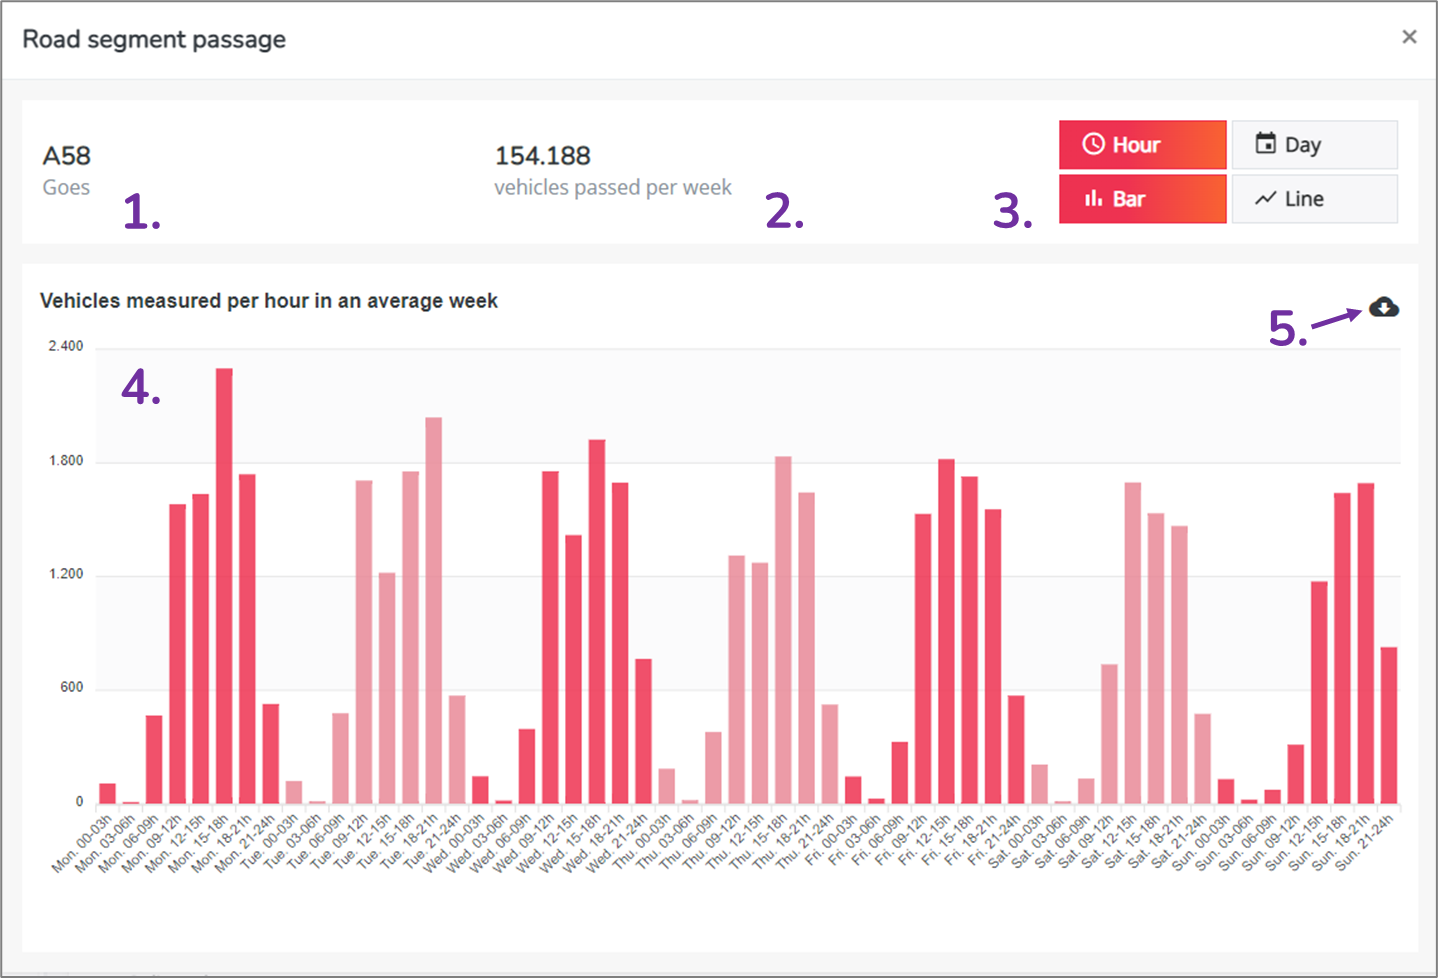
Step 4. Make sure to zoom in sufficiently and click on the number on the road segment. The road segment passage will open as a pop-up window. In the pop-up window, you can investigate the weekly passage volumes for a given road segment
The window contains:
- The name of the road segment
- The weekly passage volume
- Graph options: you have the option to choose for a line or bar plot and to choose between hourly and daily buckets
- The selected graph
- Export button to make an Excel export of the table behind the graph:
.


