Examining zone data
Zone filter
By default, you are viewing the platform for all zones (within all countries) in scope for your network. This means that all the KPIs relating to zone information (visible in the data overview below the map) will refer to all countries in scope (eg. Belgium and the Netherlands in case both are included).
However, it can be very relevant for certain users to only filter on a certain zone, region or analyze zones based on travel distances from locations or based on the sales potential.
You can use the zone filter in the left settings bar, to create and manage your own zone filters. Making any changes up here will recalculate the KPIs relating to zone information in the data overview and the applied map layers (if activated and corresponding to location data).
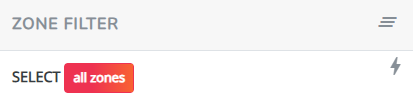
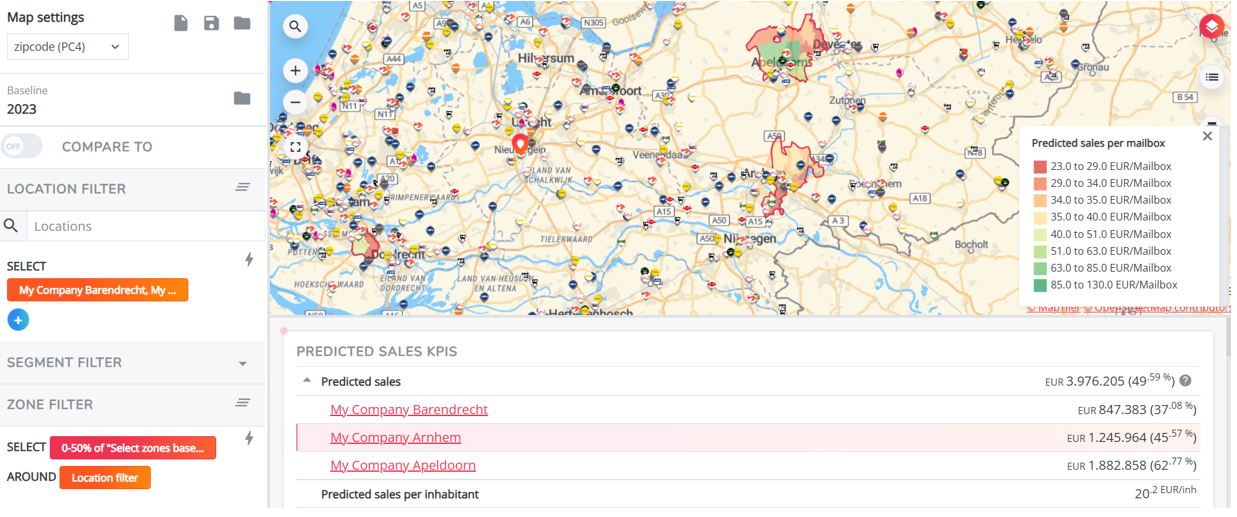
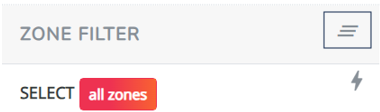
Applying a zone filter will be always visualized with a red line, framing your selection of zones - unless you have the default zone filter applied (=all zones, see screenshot above)
1. Finding single zone information
1A. Geographical zone level(s)
By default, the RetailSonar platform operates on a detailed zone level. This detailed level will be decided upon from the beginning and is the base to calculate traveltimes from zones to locations and to translate address data into zone information (using the geocoder). The detailed zone level is different for every country.
Most platforms also contain one or multiple aggregated zone levels. An aggregated zone can then be seen as a selection of multiple detailed zones, so there must be a 1on1 fit between the different levels.
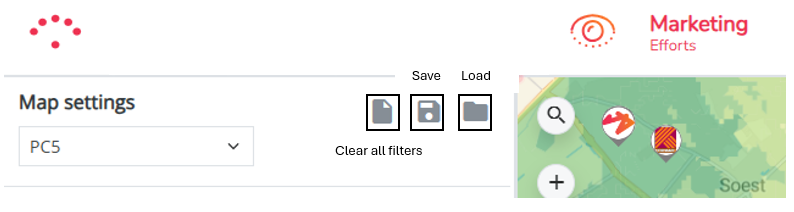
All zone information can be visualized and analyzed on all the configured zone levels for your platform. You can switch the zone levels in the Map settings section on top of the left settings bar.
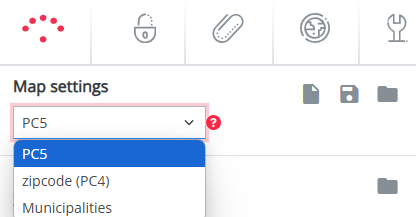
If you have applied a map layer that corresponds to zone information (such as market size or all socio-demographics) you will immediately see that the zone become bigger/smaller and that the legend of your map colours change accordingly.
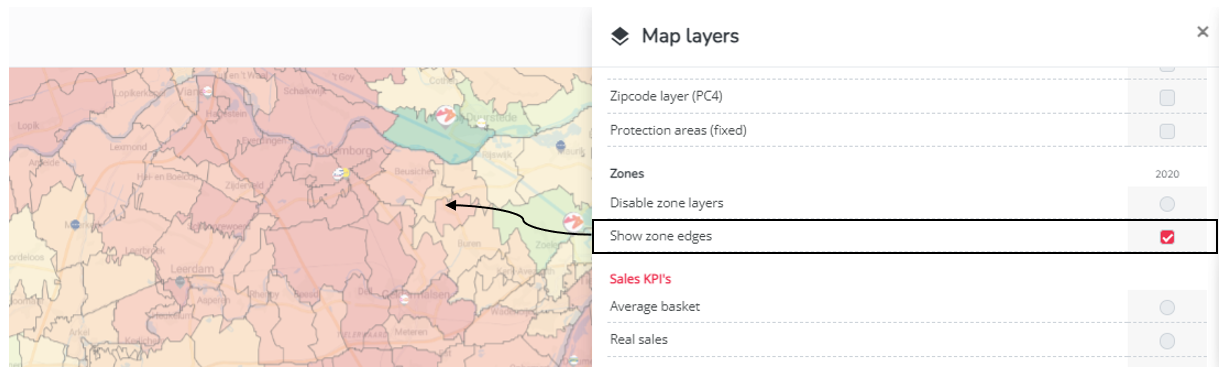
There is also a map layer that visualizes the contouring of the applied zone level. Click on the map layer icon in the top right corner of the map and activate the 'show zone edges' map layer. If you then switch zone levels you will see the contouring changing.
1B. Zone pop-ups
For single zones only, you don't really need (but you can, see below) to use the zone filter to find all relevant information.
First make sure you have applied the preferred zone level for which you want to retrieve zone information. (example for Belgium: detailed (NIS11) & aggregated (ZIPCODE))
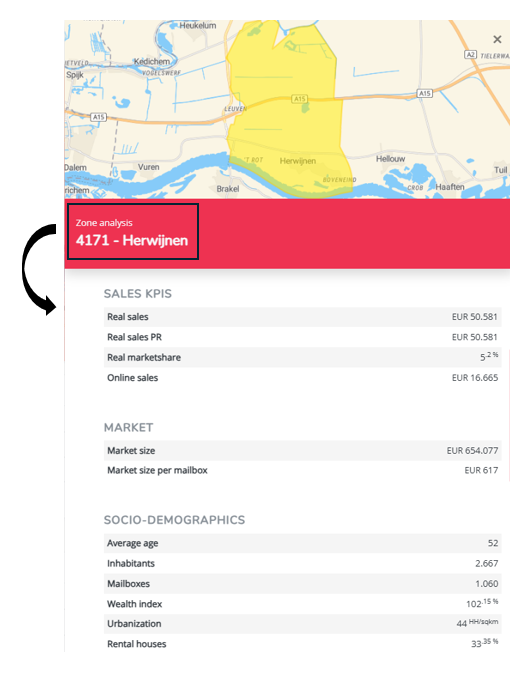
All zone information can then be accessed by clicking the zones on the map: a zone pop-up will open subsequently displaying all known location data. The unique zone code corresponds to the chosen zone level. Underneath the filter options you will see the data overview for this zone only.
1C. Zone reports
For all zones of the applied zone level; there is also an extensive zone report accessible by clicking on zone report; This report opens in a separate tab and displays besides the information from the pop-up, also a predicted market share graph (own brand vs. competitor brands) and the top 25 locations that have generated the highest sales from customers living in this zone.
All sections within this report can be exported (
2. Filtering on zone data
2A. for a random selection of zones
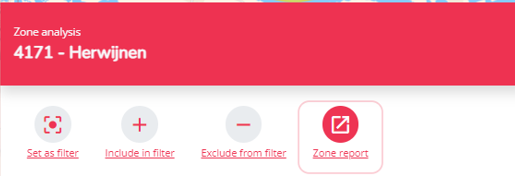
First make sure you have selected the preferred zone level (see 1A). Next click on 1 zone on the map: in the zone pop-up select 'set as filter'
.
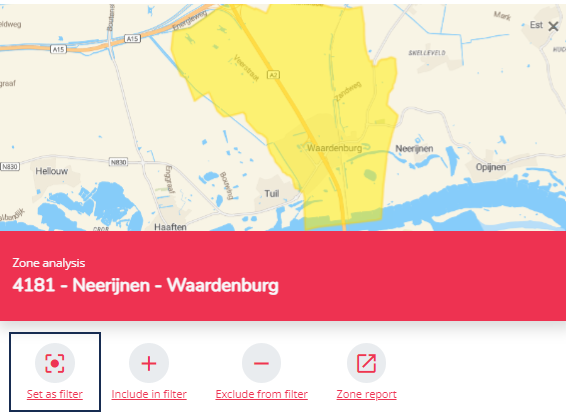
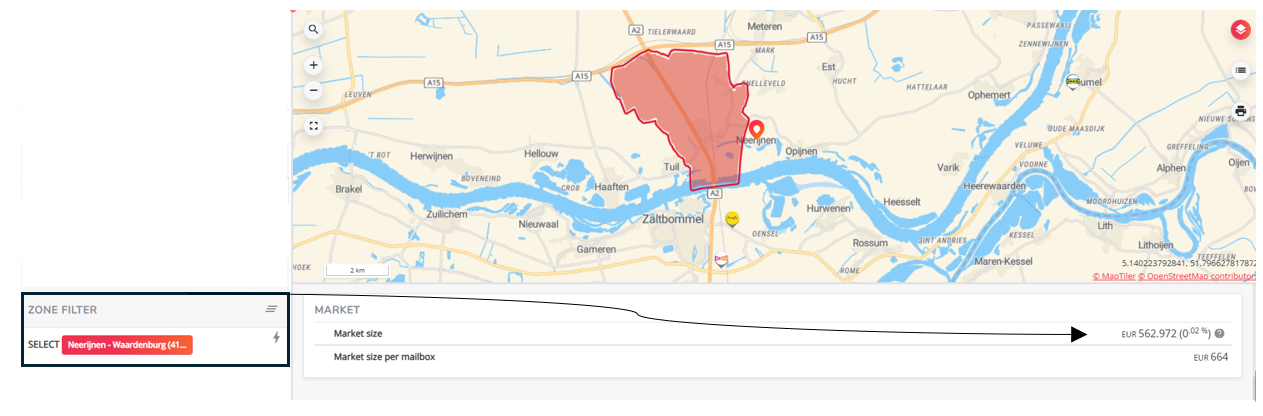
You will now see the filtered zone within the zone filter section on the left. A red line will frame the zone on the map and your KPI information below the map is calculated for this zone only;
To add single zones to the previous applied zone filter, click on another zone on the map. In the zone pop-up select 'include in filter'
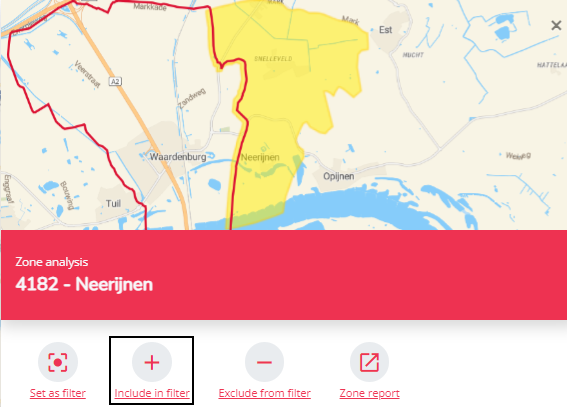
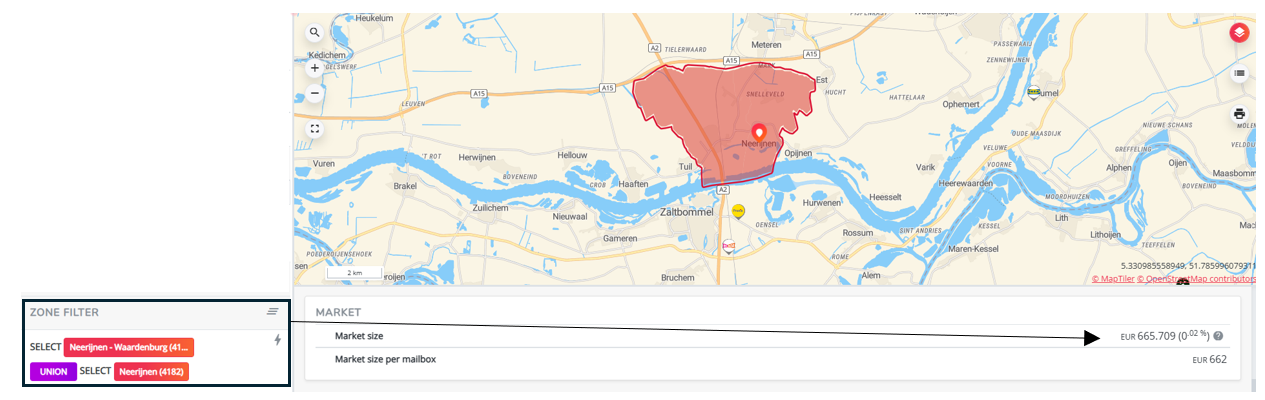
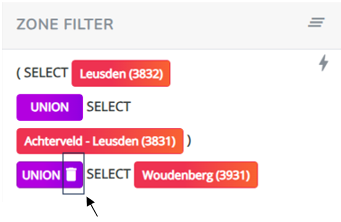
You will now see a union of the two zones within the zone filter section on the left;
To exclude a zone from the applied zone filter; click on the zone within the selection and select exclude from filter.
TIP! You need to manually apply all zones one by one, using the described approach above. However use these keyboard shortcuts to save you some clicks:
- To filter on a single zone: hold the shift key and left-click on the zone on the map: the zone is now set as a zone filter (this overwrites the previous applied zone filter)
- To add a zone to the zone filter: hold the ctrl key (cmd for Mac computers) and left-click on the zone you want to add
- To add multiple zones to the zone filter: hold the ctrl key (cmd for Mac computers) and left-click on all the zones you want to add without releasing the ctrl key. When you release the ctrl key, all zones will be added at once.
- To exclude a previously selected zone from the zone filter: hold the alt key and left-click on the zone you want to exclude
Scroll to the last part of this article to save this zone filter for another time!
2B. for a fixed or chosen travel time around one location
Instead of manually selecting zones to the filter as described in 2A, there is also the possibility to filter zones based on a travel time from a certain location. This method is more effective in case you want to analyze the environment around certain location(s).
In general, there are 3 modes of travel time that can be configured; by car, by foot or by bike. In case they are all 3 configured (datapacks are contractually defined), you can choose which mode to select to base your zone filter on.
Remark! Remember that travel times are based on the detailed zone level. So it's recommended to have the detailed zone level applied when defining zone filters based on travel time.
To check which travel time modi are configured for your platform and to use it as a zone filter; click on a certain location logo on the map (can be both from the own or competitor network). The location pop-up window will open subsequently.
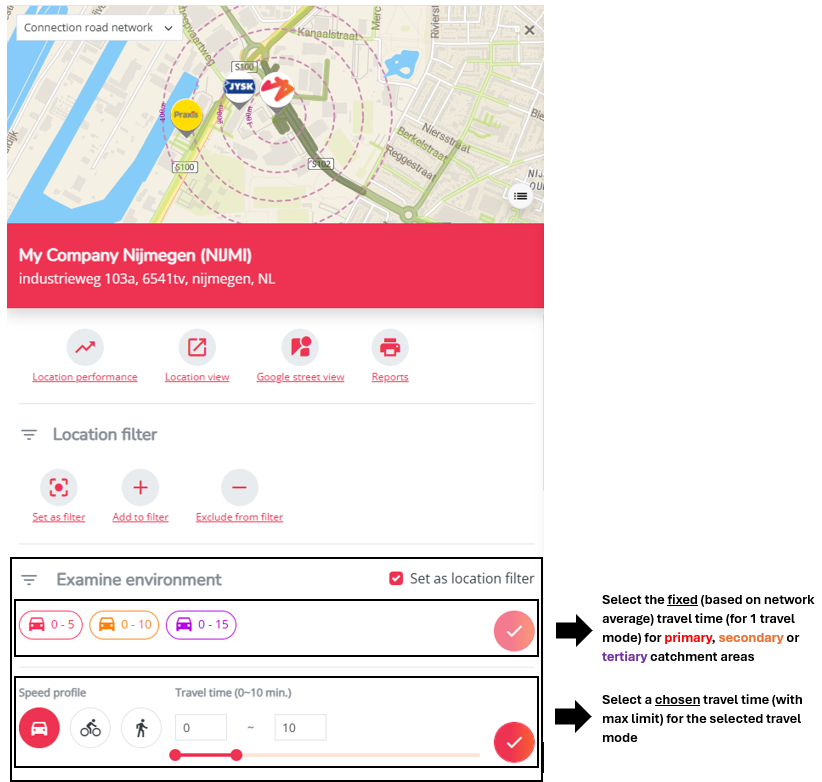
Scroll down to the Examine environment section:
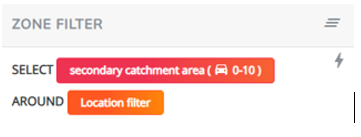
- select zones based on the average network isochrones that determine your catchment areas - click on the corresponding catchment area button and select
to activate the filter
- OR select zones based on a chosen isochrone and a chosen travel mode - select the preferred speed profile (travel mode) and use the slidebar or enter the preferred numbers in the checkboxes. Select
to activate the filter
Remark: It's only possible to visualize one travel time (and one travel mode) at the time
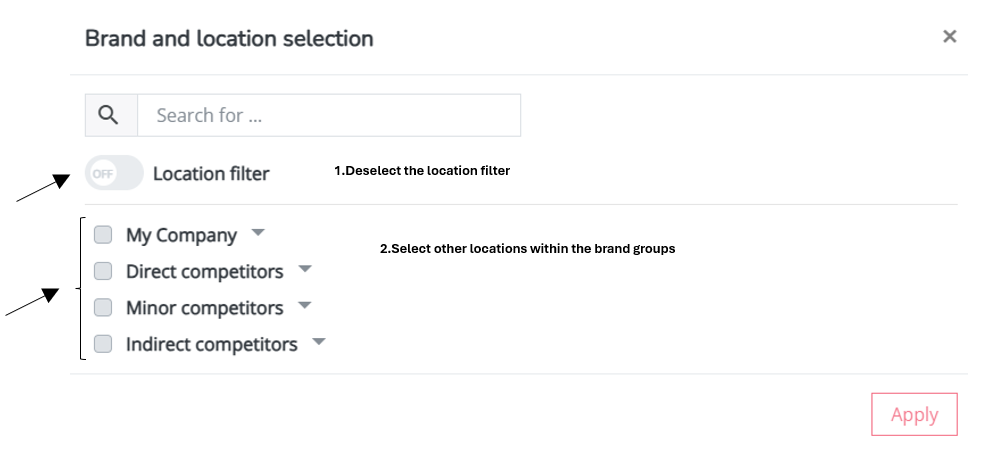
The filter section in the settings bar will now appear like this: You have applied a location filter* together with a zone filter.
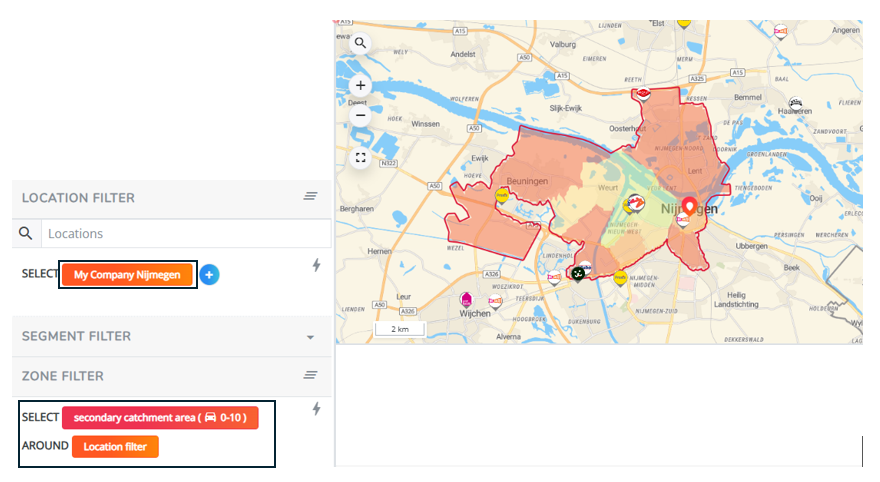
*The location filter has been set automatically because of the activated "set as location filter" checkbox. You can also deactivate it for example for this use case .
In the data overview you will now see that all location and zone data got recalculated based on these applied filters. You can now see for example how much of the total sales this location is doing within a driving distance of 10min.
2C. for a fixed or chosen travel time around multiple locations
If you'd like to analyze environments based on a travel time for multiple locations at once, this is also possible. Instead of using the location pop-up to define the zone filter, it's recommended to install the filter using the zone filter section in the settings bar on the left.
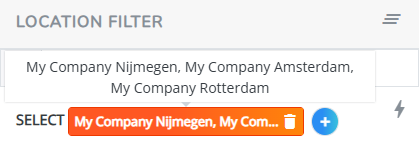
1. First make sure you have applied the locations you want to install this zone filter for to the location filter (see the article on examining location data - filtering on location data)
For example:
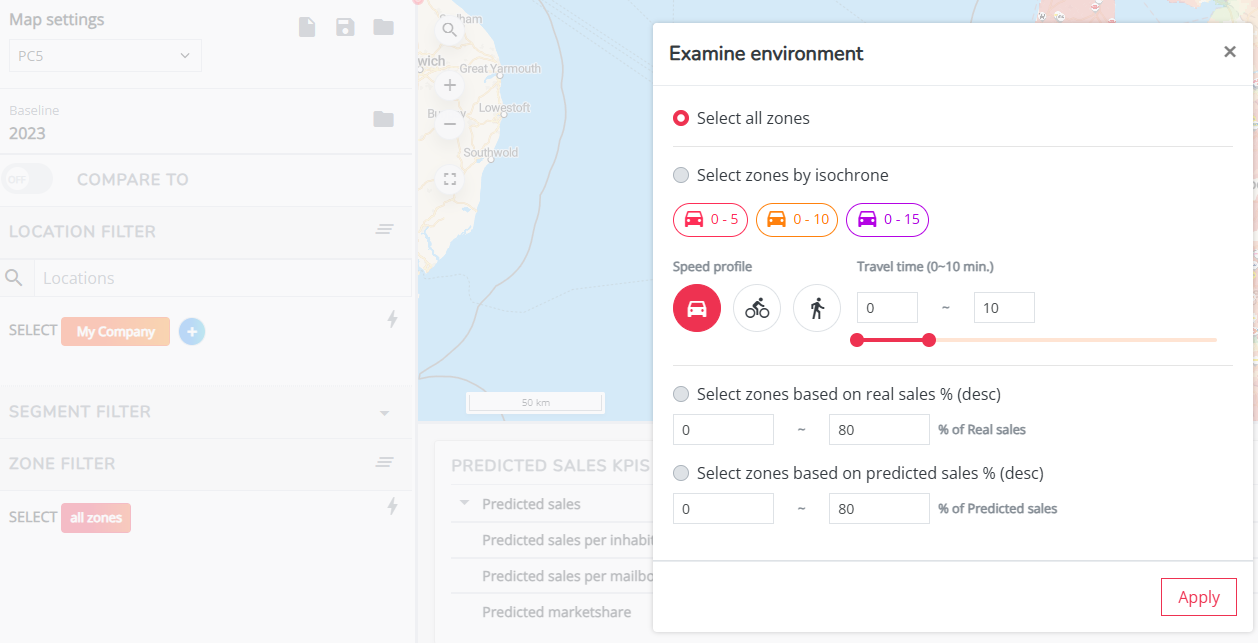
2. Next click on the orange zone filter button in the left settings bar:
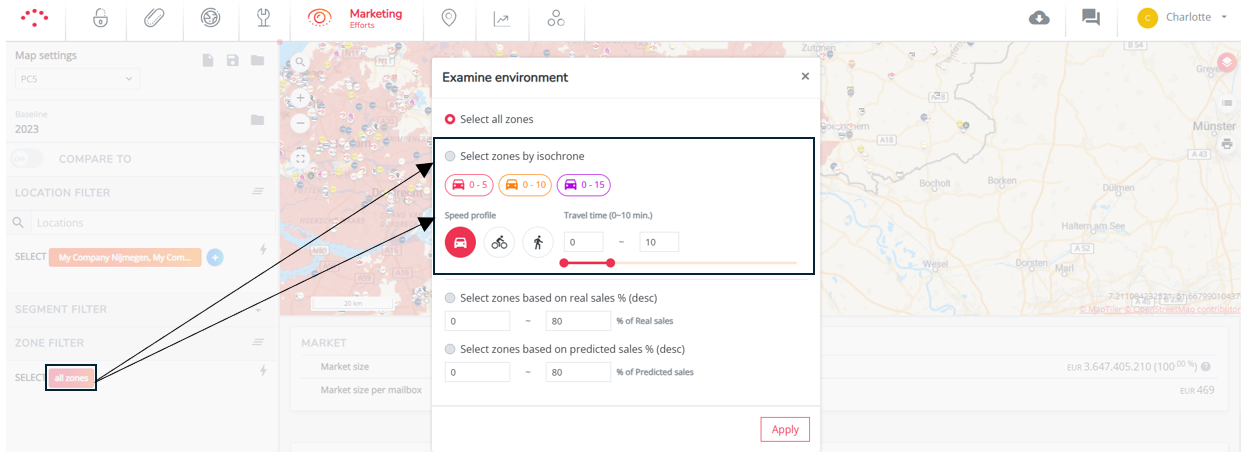
3. You can again select zones
- based on the average network isochrones that determine your catchment areas - click on the corresponding catchment area button and select apply to activate the filter
- OR select zones based on a chosen travel mode & trave time - select the preferred speed profile (travel mode) and use the slidebar or enter the preferred numbers in the checkboxes. Select apply to activate the filter.
4. In the data overview you will now see that all location and zone data got recalculated based on these applied filters.
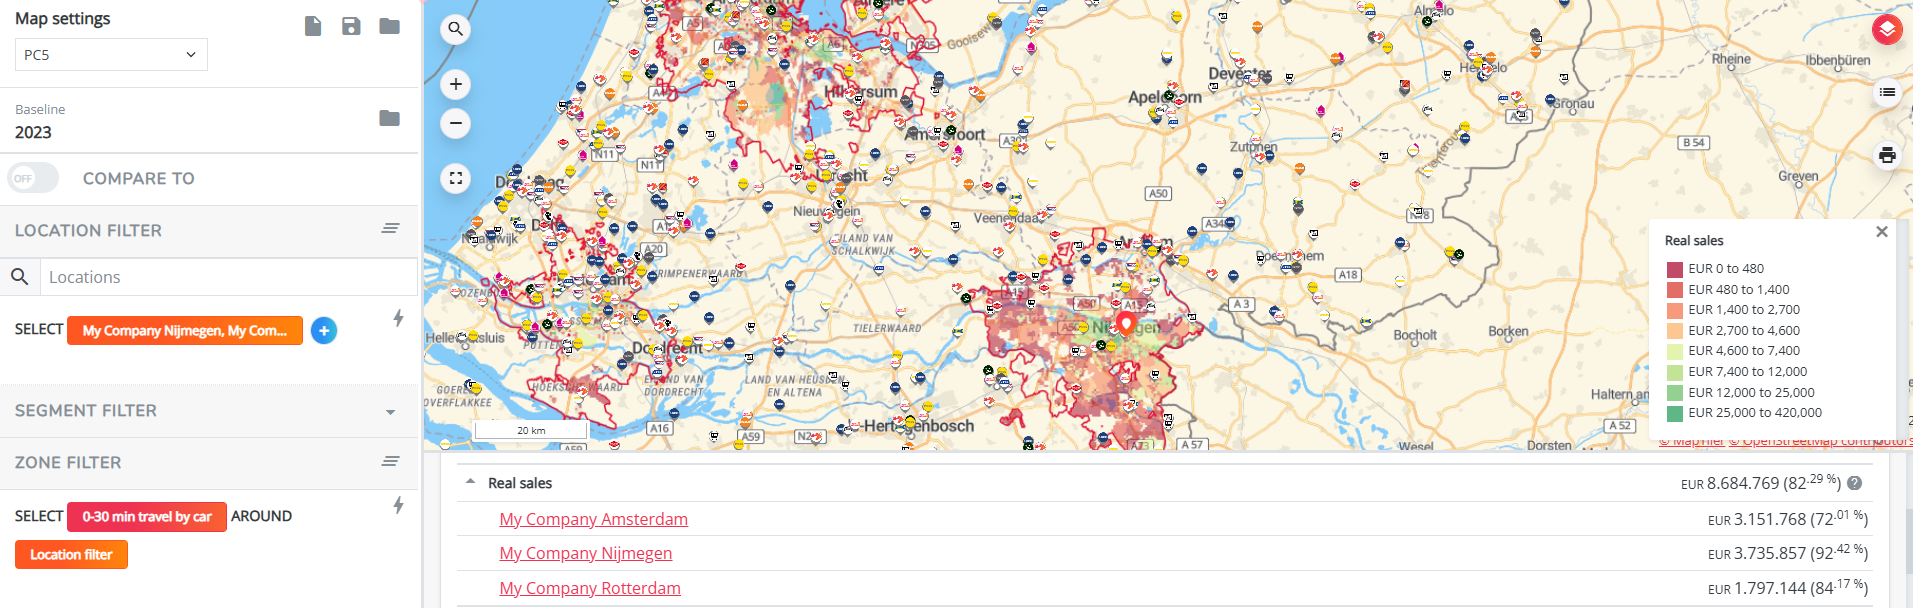
2D. based on the real or potential sales of a location
There is also the possibility to filter zones based on the real (mostly for explore platforms) or predicted sales (predict platforms) of locations. We call this method filtering on predefined customer areas. The exact definition for the predefined customer area on your platform can differ per platform and should be the one that is most relevant. The reasoning behind this filtering option is to identify the zones where (predicted) sales for the location is the highest so you can use this for campaign targeting purposes.
For example:
- If you make use of leaflets for your local marketing campaign, the following customer areas can be configured:
- Zone selection based on real sales per mailbox % (descending) (explore platforms)
- Zone selection based on predicted sales per mailbox % (descending) (%) (predict platforms)
- If your mostly using digital advertising campaigns, the following customer areas can be configured:
- Zone selection based on real market share % (descending)
- Zone selection based on predicted market share % (descending)
Remark! Depending on the customer area that has been configured for your platform, it makes sense to use the geographical zone level (see 1A) that matches your campaign targeting method (eg. zipcode for digital advertising and BD for leaflets)
To apply this filtering option, there are 2 methods:
- To define a customer area for one location only:
- Click on the location logo on the map
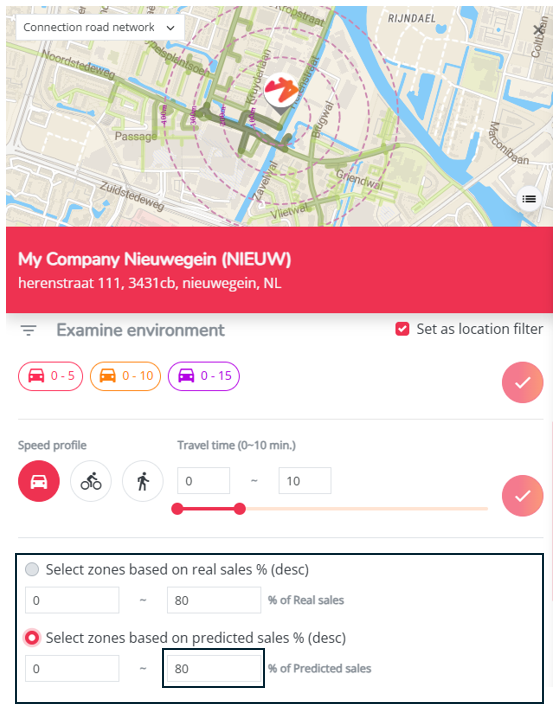
- In the location pop-up window, scroll down below the examine environment options
- By default there is only 1 customer area configured (but extra/multiple customer areas can be agreed upon contractually). Select the customer area filter option and enter the (potential) sales coverage you want to reach with your campaign by adjusting the percentage* in the checkbox. After click apply to see which collection of zones to target. (*100% sales coverage means you want to target every single zone where customers might or have spend money in the location = expensive campaign option in case of leaflets. So adjust the percentage according to campaign budget)
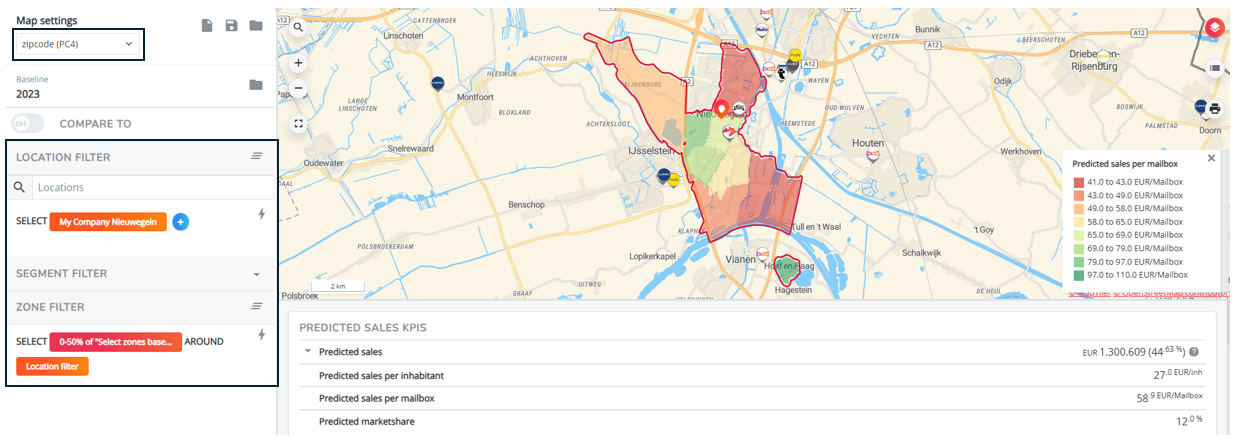
- Your resulting settings will now look like the image below. You can still choose to apply the same map layer as your defined customer area. For the example below you can now see that to reach the 50% predicted sales coverage, the zones with the highest predicted sales per mailbox are selected according to the legend.
- To define customer areas for multiple locations at once:
- First select those locations to your location filter
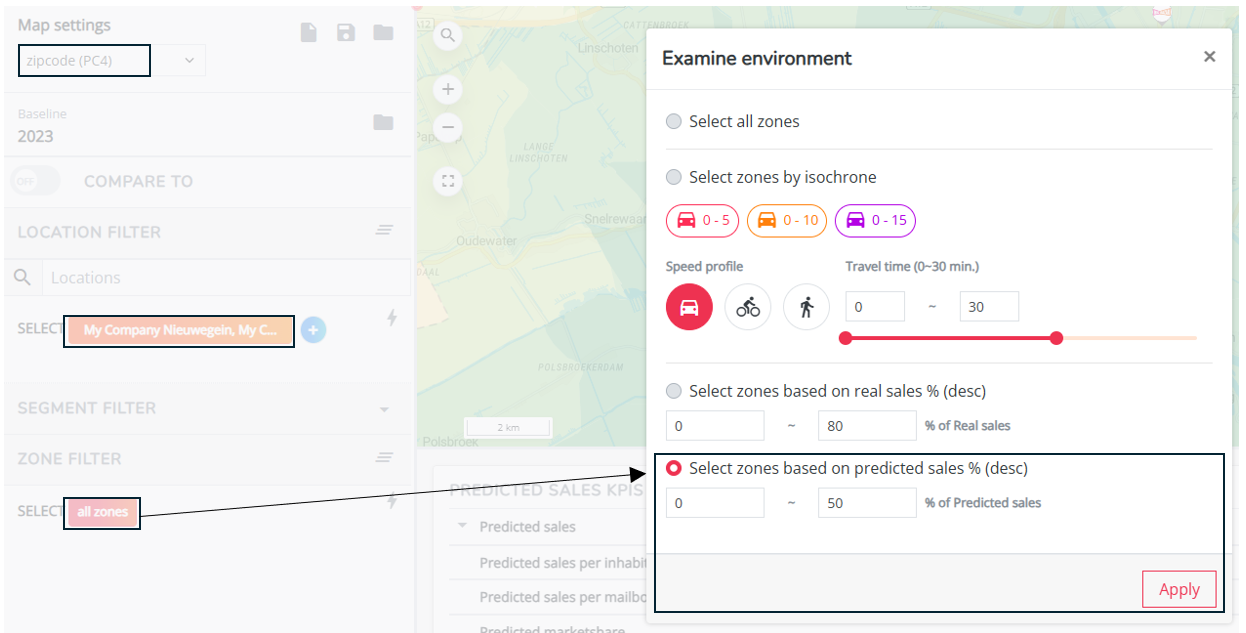
- Click on the orange zone filter button in the zone filter section of the settings bar. (make sure the previous zone filter is deleted and is set as 'all zones')
- Select the customer area filter option and enter the (predicted) sales coverage you want to reach with your campaign by adjusting the percentage* in the checkbox. For the final selection of zones, the customer area will now look at the real/predicted sales of all locations in the location filter and select zones according to the highest total sales (predicted).
- Your resulting settings will now look like the image below. You can for example see here that to reach a total predicted sales coverage of 50% for 3 locations, Apeldoorn has the highest predicted coverage (64,44%) in the total zone selection for the 3 locations. This is because the highest sales potential per mailbox is predicted in the zipcode zones of Apeldoorn (compared to the sales potential per mailbox in the zones around Barendrecht and Arnhem)
2E. based on other conditions
More advanced filter options are possible to configure. For example zone filters based on provinces, regions, based on % welfare index etc.
These will then be assessable by loading the corresponding view, displaying the advanced filter options.
> Contact our customer support team to know what is possible.
3. Saving & deleting (zone) filters
If you are using certain zone filters a lot, aside from the default 'all zones', you can always save them by clicking 'save' on top of the settings bar. Give your settings a name and click the 'load' button to retrieve it another time.
At any time, you can go back to the default zone filter by deleting the previous applied filters.
- Clear only the zone filter
: reset to 'all zones'.
- Clear only a certain part of the zone filter: click on the trashcan icon in the added zone filter
- Clear all settings all in once
: reset to the default settings
Remarks
- Zone filters are always drawn around a specific selection of locations (location filter). Hovering with your cursor over a red filter button will show you which environment filter is added to the zone filter. Hovering over an orange filter button will show you the locations around which the environment filter is applied.
- In case you are using the filter options as described in 2B and 2C, you can also analyze more advanced cases. When you would click on the orange perspective button within the zone filter section, you can still change the locations for which you want to define this environment. You can now switch the location filter to any location data you would like to analyze within the selected zone environments.