Exploring your market context (Marketing Efforts)
When to use this workflow
Use this workflow in the Marketing Efforts module when you want to understand whether a location or area is commercially interesting before moving to a detailed opportunity assessment.
Marketing Efforts helps you understand the market context around a location or area.
In this module, you can explore:
- where demand is concentrated
- which competitors are already active
- which local activity is present nearby
- whether mobility signals support the location
- whether practical feasibility constraints may apply
Step 1. Make sure you're in the Marketing Efforts module

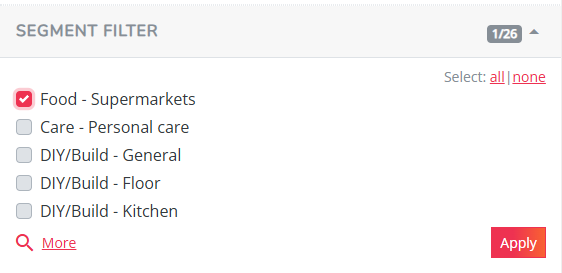
Step 2. Select the right segment
Start by selecting the segment that matches your use case in the selection panel on the left. Click "more" if you don't see your sector in the first 5 segments.
[screenshot]
The selected segment is important because it determines:
- how the market size is calculated
- which competitors are considered relevant
- how the area is evaluated commercially
In other words, changing the segment changes the lens through which you analyze the market.
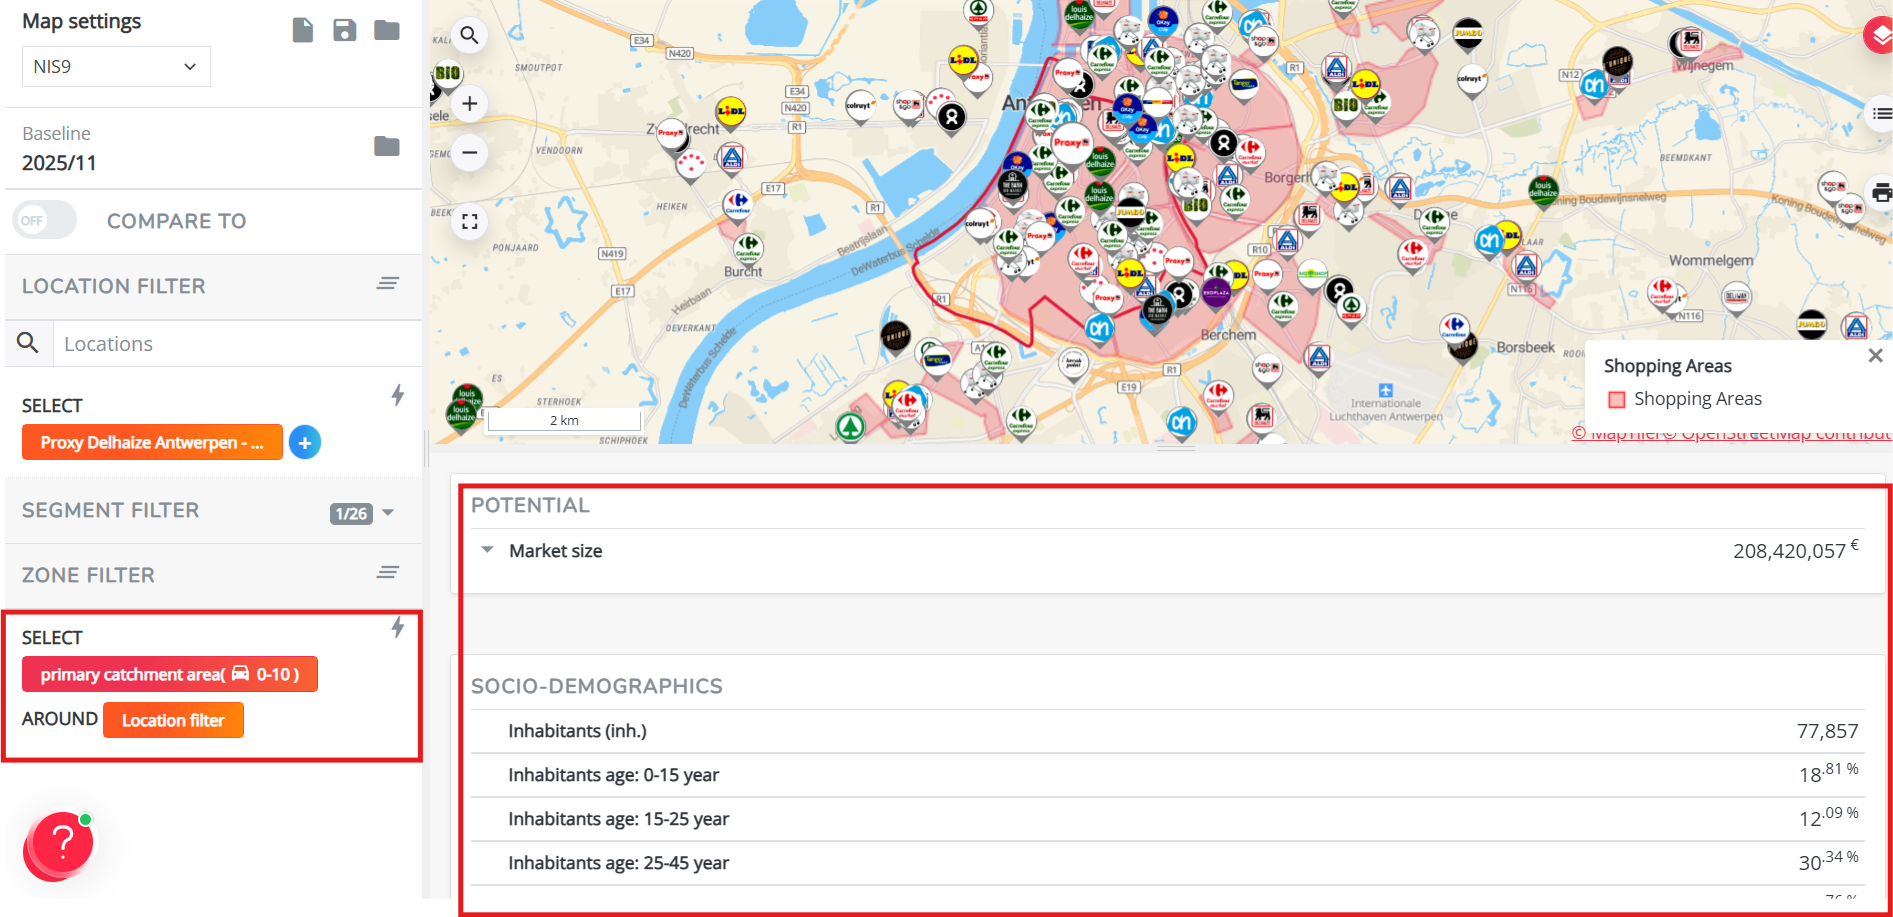
Step 3. Analyze the market size
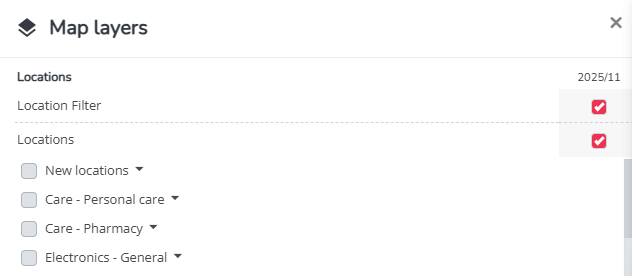
Open the map layer panel (top right corner of the map ) and activate the Market Size layer.
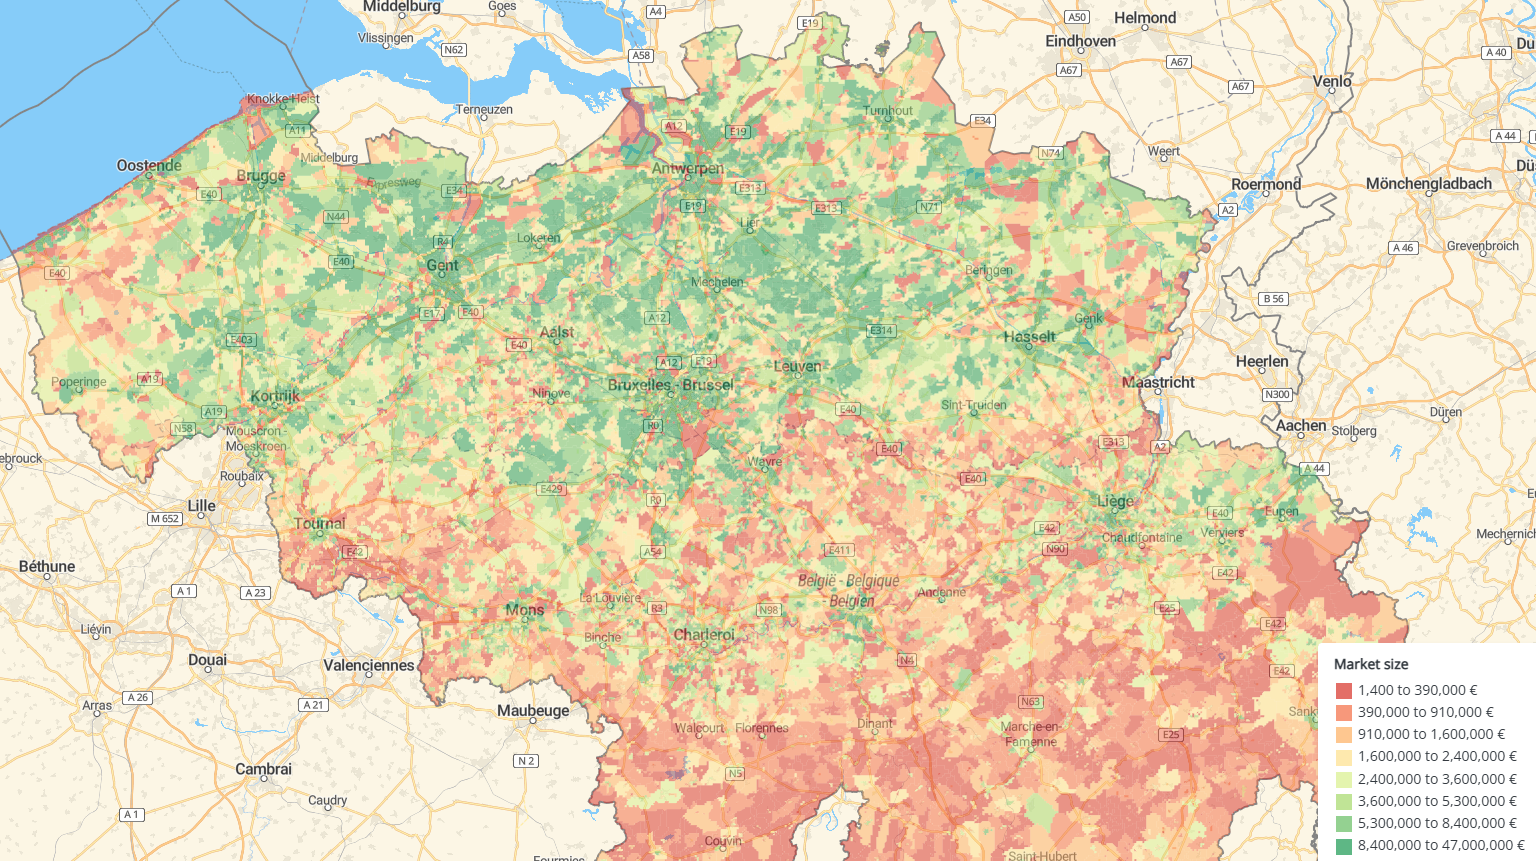
This layer shows where demand is concentrated for the selected segment. Use it to identify areas with strong or limited market potential.
To analyze an area:
- Zoom in until values appear on the map.
- Open the legend (
) to understand the strength of the market size.
- Click on a zone to view more detailed information.
A strong market size can indicate an interesting area, but it should always be validated with the next steps.
Step 4. Validate the local profile
Use the socio-demographic layers (only one selectable at a time) to check whether the local profile matches the segment or concept you're evaluating.
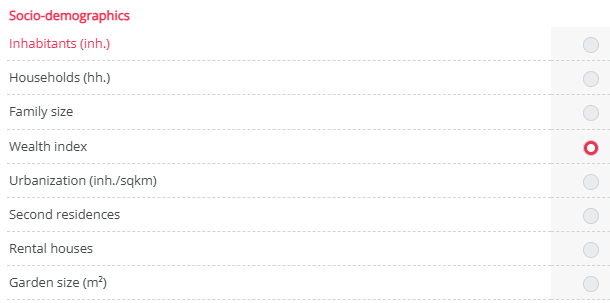
This helps you understand not only whether there is enough potential, but also whether the area has the right type of potential. For example:
- An area may have high potential, but the customer profile may not match your concept.
- An area may have the right profile, but the total volume may be limited.
These layers help you explain the fit or mismatch.
Step 5. Review competition
Activate the competitor layer by clicking "locations" to see which relevant competitors are active in the selected segment from step 2.
This helps you understand whether the area appears competitive, saturated, underserved, or potentially interesting as whitespace.
- If an area looks saturated, the key question is whether there is still room for an additional location. Quantify this with the Which Segments Have Room? (General Report).
- If an area shows whitespace, the key question is whether this is a real opportunity, or whether there's a reason competitors are absent. Investigate this with the Which Retailers Are Missing From the Area? (Expansion Opportunities Report).
Step 6. Review local activity and shopping areas
Use the local activity layers to understand the commercial ecosystem around the location.
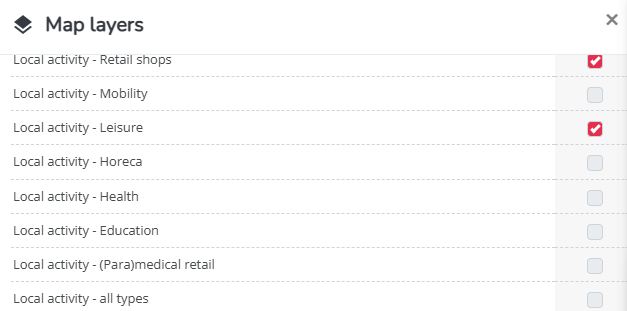
Local activity can include nearby points of interest, complementary brands, activity hubs, and other relevant places that may support performance.
You can also activate the Shopping Area layer to understand broader commercial attraction.
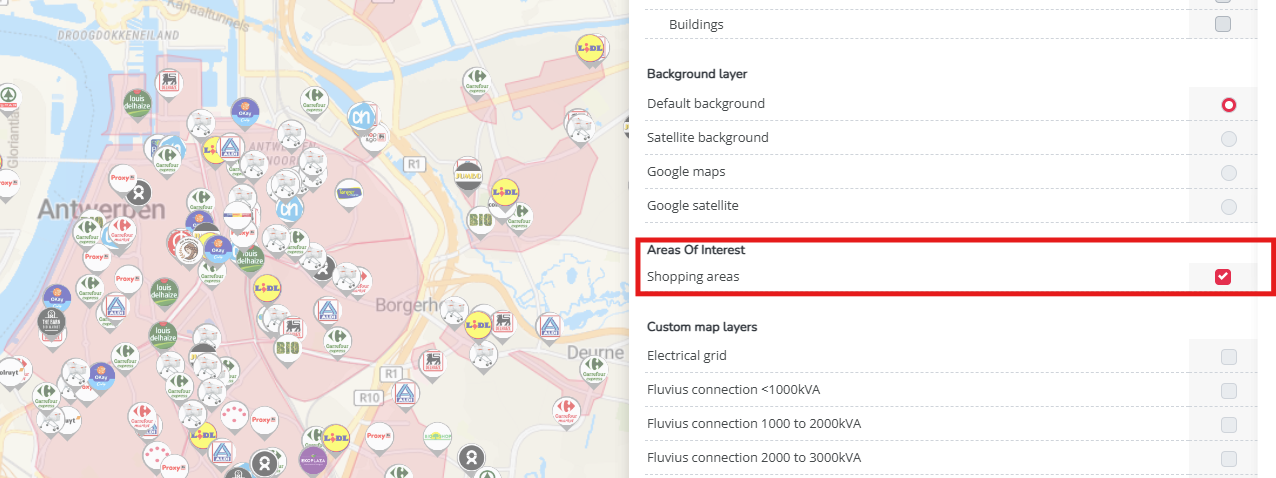
When you click on a shopping area, you can view statistics such as visit levels, visit motives, and visitor profiles.
A simple way to interpret the difference: Shopping areas explain broader attraction. Local activity explains the direct local ecosystem around the location.
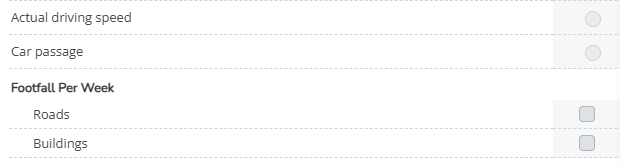
Step 7. Check mobility indicators
Use mobility layers such as car passage and footfall to understand movement patterns around the location.
These indicators help you validate whether the location behaves as expected for the selected segment and format.
For example:
- Car passage helps assess visibility and drive-by exposure.
- Footfall helps assess pedestrian intensity and local movement.
Step 8. Check feasibility indicators, if relevant
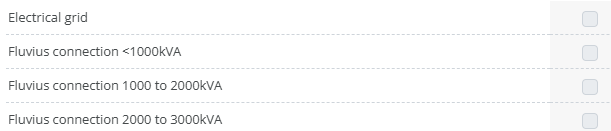
Depending on your use case, you can also activate feasibility layers, such as the Fluvius connection cost.
These layers help identify practical constraints at an early stage. This can be useful when certain tenants or concepts require specific infrastructure or network capacity.
A location may look commercially attractive, but feasibility indicators can reveal constraints that make the opportunity harder to realize.
How to interpret the results?
By the end of your explorative analysis, you should be able to summarize the area in one short story:
- Is the market potential strong or limited?
- Does the socio-demographic profile match the selected segment?
- Is the area saturated, competitive, or underserved?
- Do local activity and shopping area signals support the location?
- Do mobility indicators confirm the expected movement patterns?
- Are there feasibility constraints to consider?
Use this first analysis as input for Location Planning, where the opportunity for a specific property can be quantified in more detail.
To do this, continue to Getting Started in Location Planning.
Helpful tip: Use an isochrone
For a clearer overview around a location, draw an area or isochrone around a competitor site in the area. This helps you combine market size, competitors, local activity, shopping areas, and mobility indicators into one practical analysis.
Therefore click on the competitor logo on the map, and select your preferred isochrone settings.
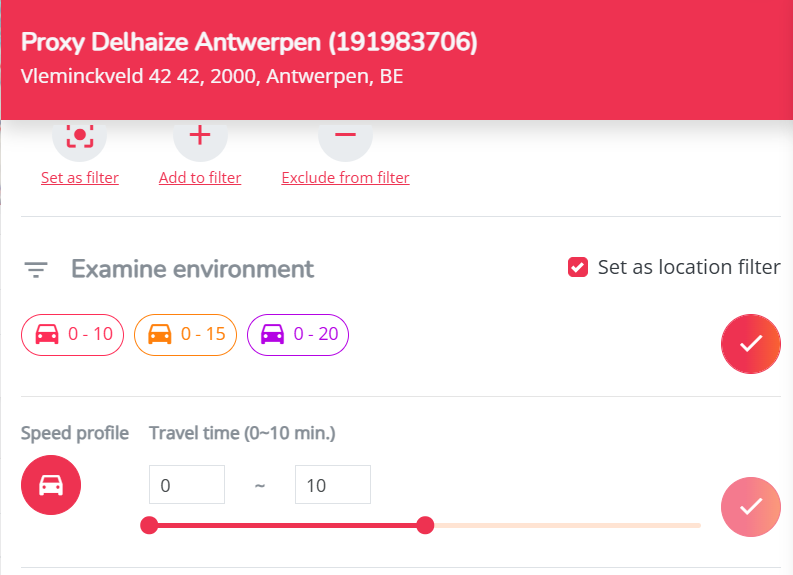
The figures you see below the map are now filtered on these zones only.